While working on a Canvas App within Power Apps, we encountered a scenario where we needed an automated calculation to handle tax computations. Typically, this would require creating a new calculated field within the Dataverse to perform the calculation. However, adding a calculated field to the Dataverse seemed unnecessary in this case, as the calculation was only required within the Canvas App itself.
As we explored this challenge further, we discovered that Power Fx offers a powerful solution for dynamically manipulating data. By leveraging temporary calculated columns, we can perform on-the-fly calculations without permanently modifying the database schema. This approach enables us to implement complex calculations, like tax computations, directly within the app, using dynamic formulas that are not stored in the Dataverse.
In this blog, we will walk you through a practical use case where we use Power Fx functions such as AddColumns, DropColumns, RenameColumns, and ShowColumns.
Power Fx Functions for Data Manipulation
1.AddColumns
The AddColumns allows you to create calculated fields dynamically within the app. This is particularly useful when you want to display data that is a result of some calculation or transformation, without needing to store it in the Dataverse.
Syntax: AddColumns( DataSource, “NewColumnName”, Formula )
DataSource: The source table or collection.
“NewColumnName”: The name of the temporary column to be added.
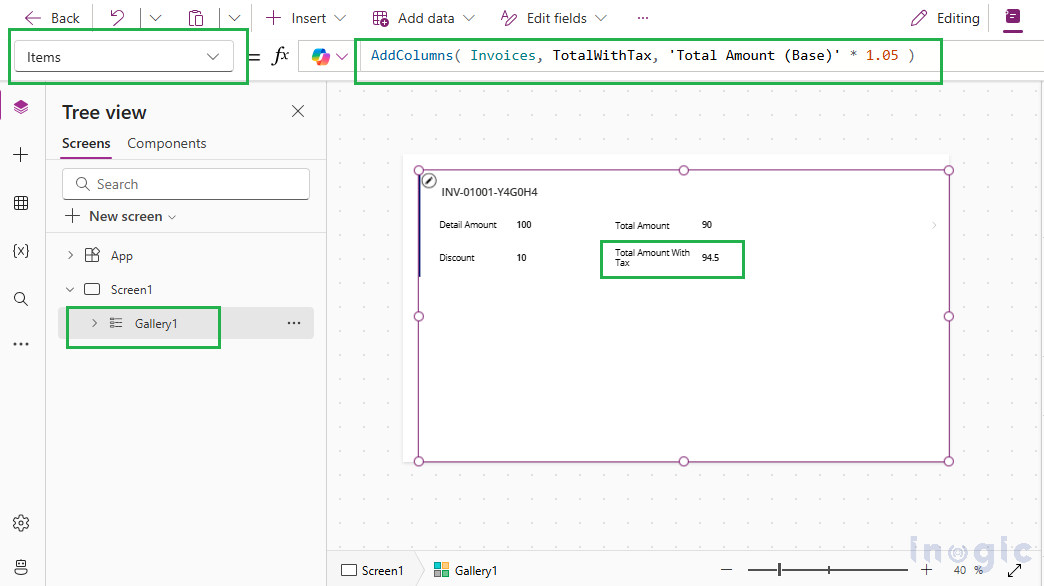
Imagine you have a collection of invoices, and you want to display a column showing the total amount, including a 5% tax. You can use AddColumns to create a “TotalWithTax” column dynamically by using the below formula.
AddColumns(Invoices, TotalWithTax, ‘Total Amount (Base)’ * 1.05)
This adds a new column, “TotalWithTax”, where each row in the Invoices table is multiplied by 1.05 to account for a 5% tax.
2.ShowColumns
ShowColumns allows you to specify only the columns you want to display. This is especially helpful when you have large datasets but only need to show a few specific fields.
Syntax: ShowColumns( DataSource, “ColumnName1”, “ColumnName2” )
DataSource: The source table or collection.
“ColumnName1”, “ColumnName2”: The names of the columns you want to display.
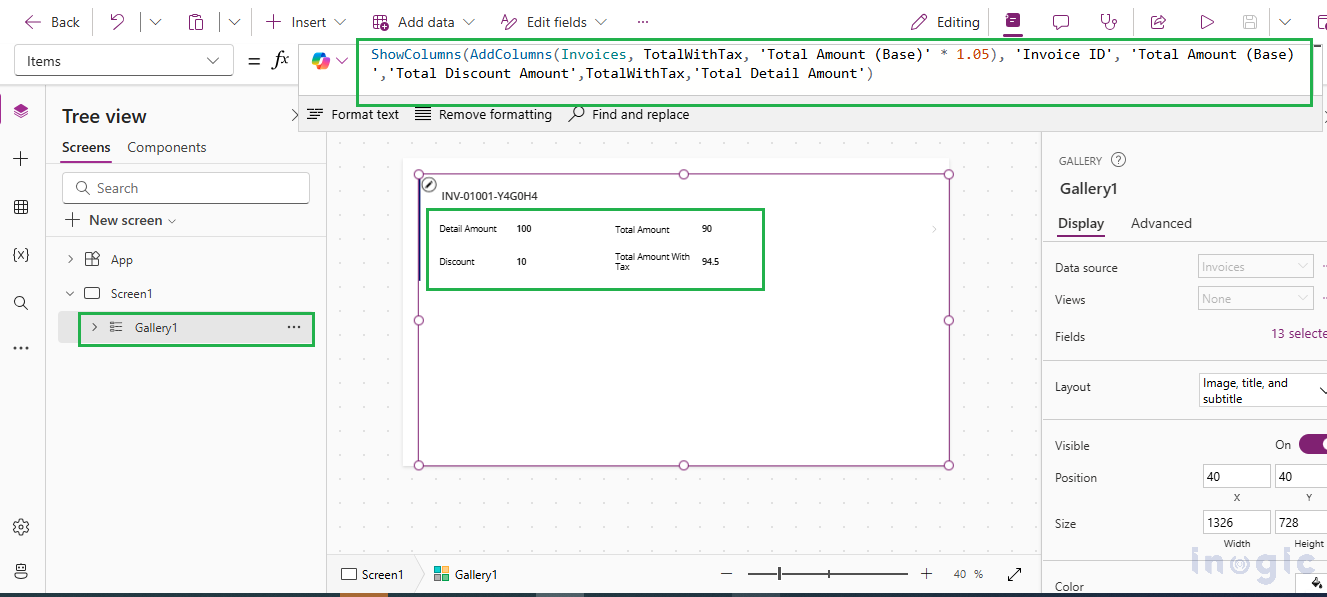
If your Invoices collection contains many columns but you only want to show Invoice ID, Total Amount, Total Discount Amount, TotalWithTax, Total Detail Amount, and Amount Due on a screen, you can use ShowColumns to limit the displayed columns as shown in below screenshot.
ShowColumns( Invoices, 'Invoice ID', 'Total Amount (Base)','Total Discount Amount',TotalWithTax,'Total Detail Amount','Amount Due')
For cases where a calculated column like TotalWithTax is needed, combine AddColumns within ShowColumns:
ShowColumns(AddColumns(Invoices, TotalWithTax, ‘Total Amount (Base)’ * 1.05), ‘Invoice ID’, ‘Total Amount (Base)’,’Total Discount Amount’,TotalWithTax,’Total Detail Amount’,’Amount Due’)
3.RenameColumns
Renaming columns can help improve the clarity of your UI by using more user-friendly names. The RenameColumns function allows you to change column names dynamically in your Canvas App.
Syntax: RenameColumns( DataSource, “OldColumnName”, “NewColumnName” )
DataSource: The source table or collection.
“OldColumnName”: The current name of the column.
“NewColumnName”: The new name that will be displayed.
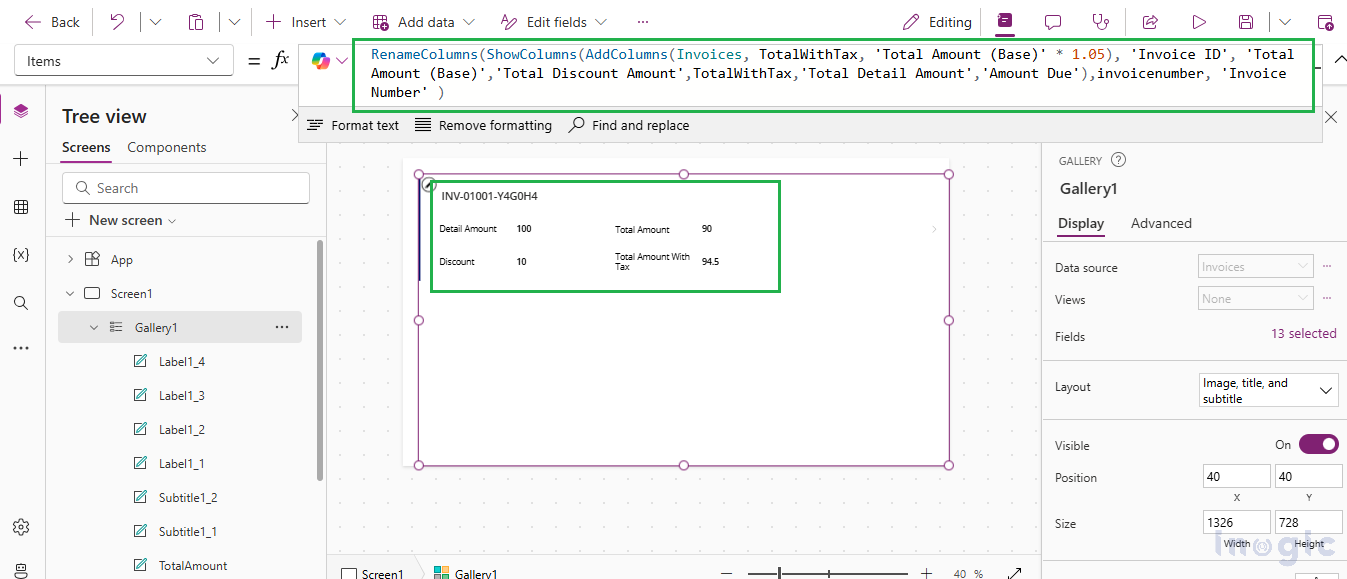
If you want to rename a column name like invoicenumber to something more user-friendly like Invoice Number, you can use the RenameColumns function as shown below.
RenameColumns( Invoice ,invoicenumber, ‘Invoice Number’ )
Complete Code:
RenameColumns(ShowColumns(AddColumns(Invoices, TotalWithTax, 'Total Amount (Base)' * 1.05), 'Invoice ID', 'Total Amount (Base)','Total Discount Amount',TotalWithTax,'Total Detail Amount','Amount Due'),invoicenumber, 'Invoice Number' )
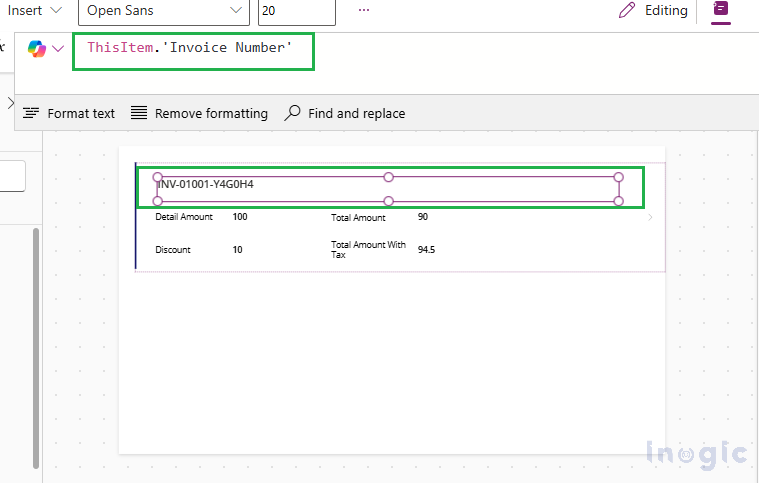
As shown in the screenshot below, the ‘InvoiceNumber’ column has been renamed to ‘Invoice Number’.
4. DropColumns
Sometimes, the data source might include columns that are unnecessary for a particular view. Instead of modifying the data source, you can use the DropColumns function to remove those columns temporarily from your view.
Syntax: DropColumns( DataSource, “ColumnName1”, “ColumnName2” )
DataSource: The source table or collection.
“ColumnName1”, “ColumnName2”: The names of the columns to be dropped from the display.
If you have a collection with information like Amount Due that you don’t want to display on a screen, you can drop that column dynamically by using the below syntax.
DropColumns( Invoices, ” msdyn_amountdue ” )
Complete Code:
DropColumns(RenameColumns(ShowColumns(AddColumns(Invoices, TotalWithTax, 'Total Amount (Base)' * 1.05), 'Invoice ID', 'Total Amount (Base)','Total Discount Amount',TotalWithTax,'Total Detail Amount','Amount Due'),invoicenumber, 'Invoice Number' ),msdyn_amountdue )

Conclusion
The ability to dynamically manipulate data within Canvas Apps using Power Fx provides developers with a powerful tool to create more responsive and flexible user interfaces. By using functions like AddColumns, DropColumns, RenameColumns, and ShowColumns, we can enhance the user experience without creating additional fields in D365 CRM.
