In our earlier article we talked about the new app designer experience and with the new updates in the app designer, command bar or the ribbon bar editor also gets an update.
Editing or defining Command bar had been a tedious task involving editing the xml tags and I remember I could never get it right the first time especially since it involved adding a lot of related tags, until we had the now popular community tools like the Ribbon Workbench and Visual Ribbon Editor come up and now editing command bar is equivalent to using the Ribbon workbench. There would be hardly any folks that might even know how to add these without the help of these tools.
Microsoft now presents a simplified command bar designer with its new app designer experience that is currently in preview.
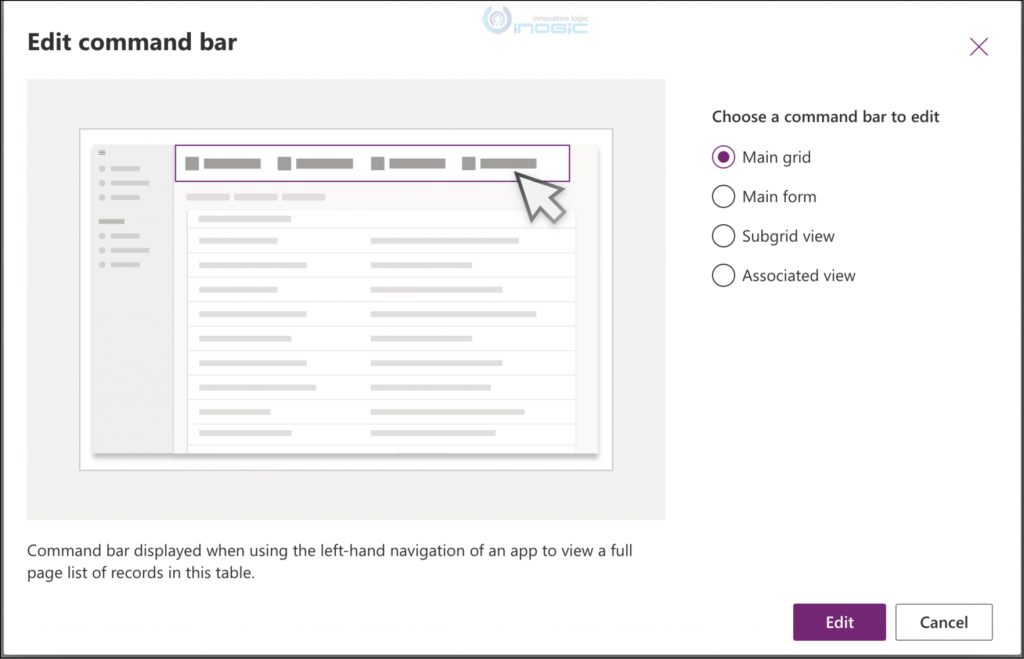
From the app designer, choose the table and click on the ellipsis to bring up the command bar editor.
Choose the command bar type you would like to edit.
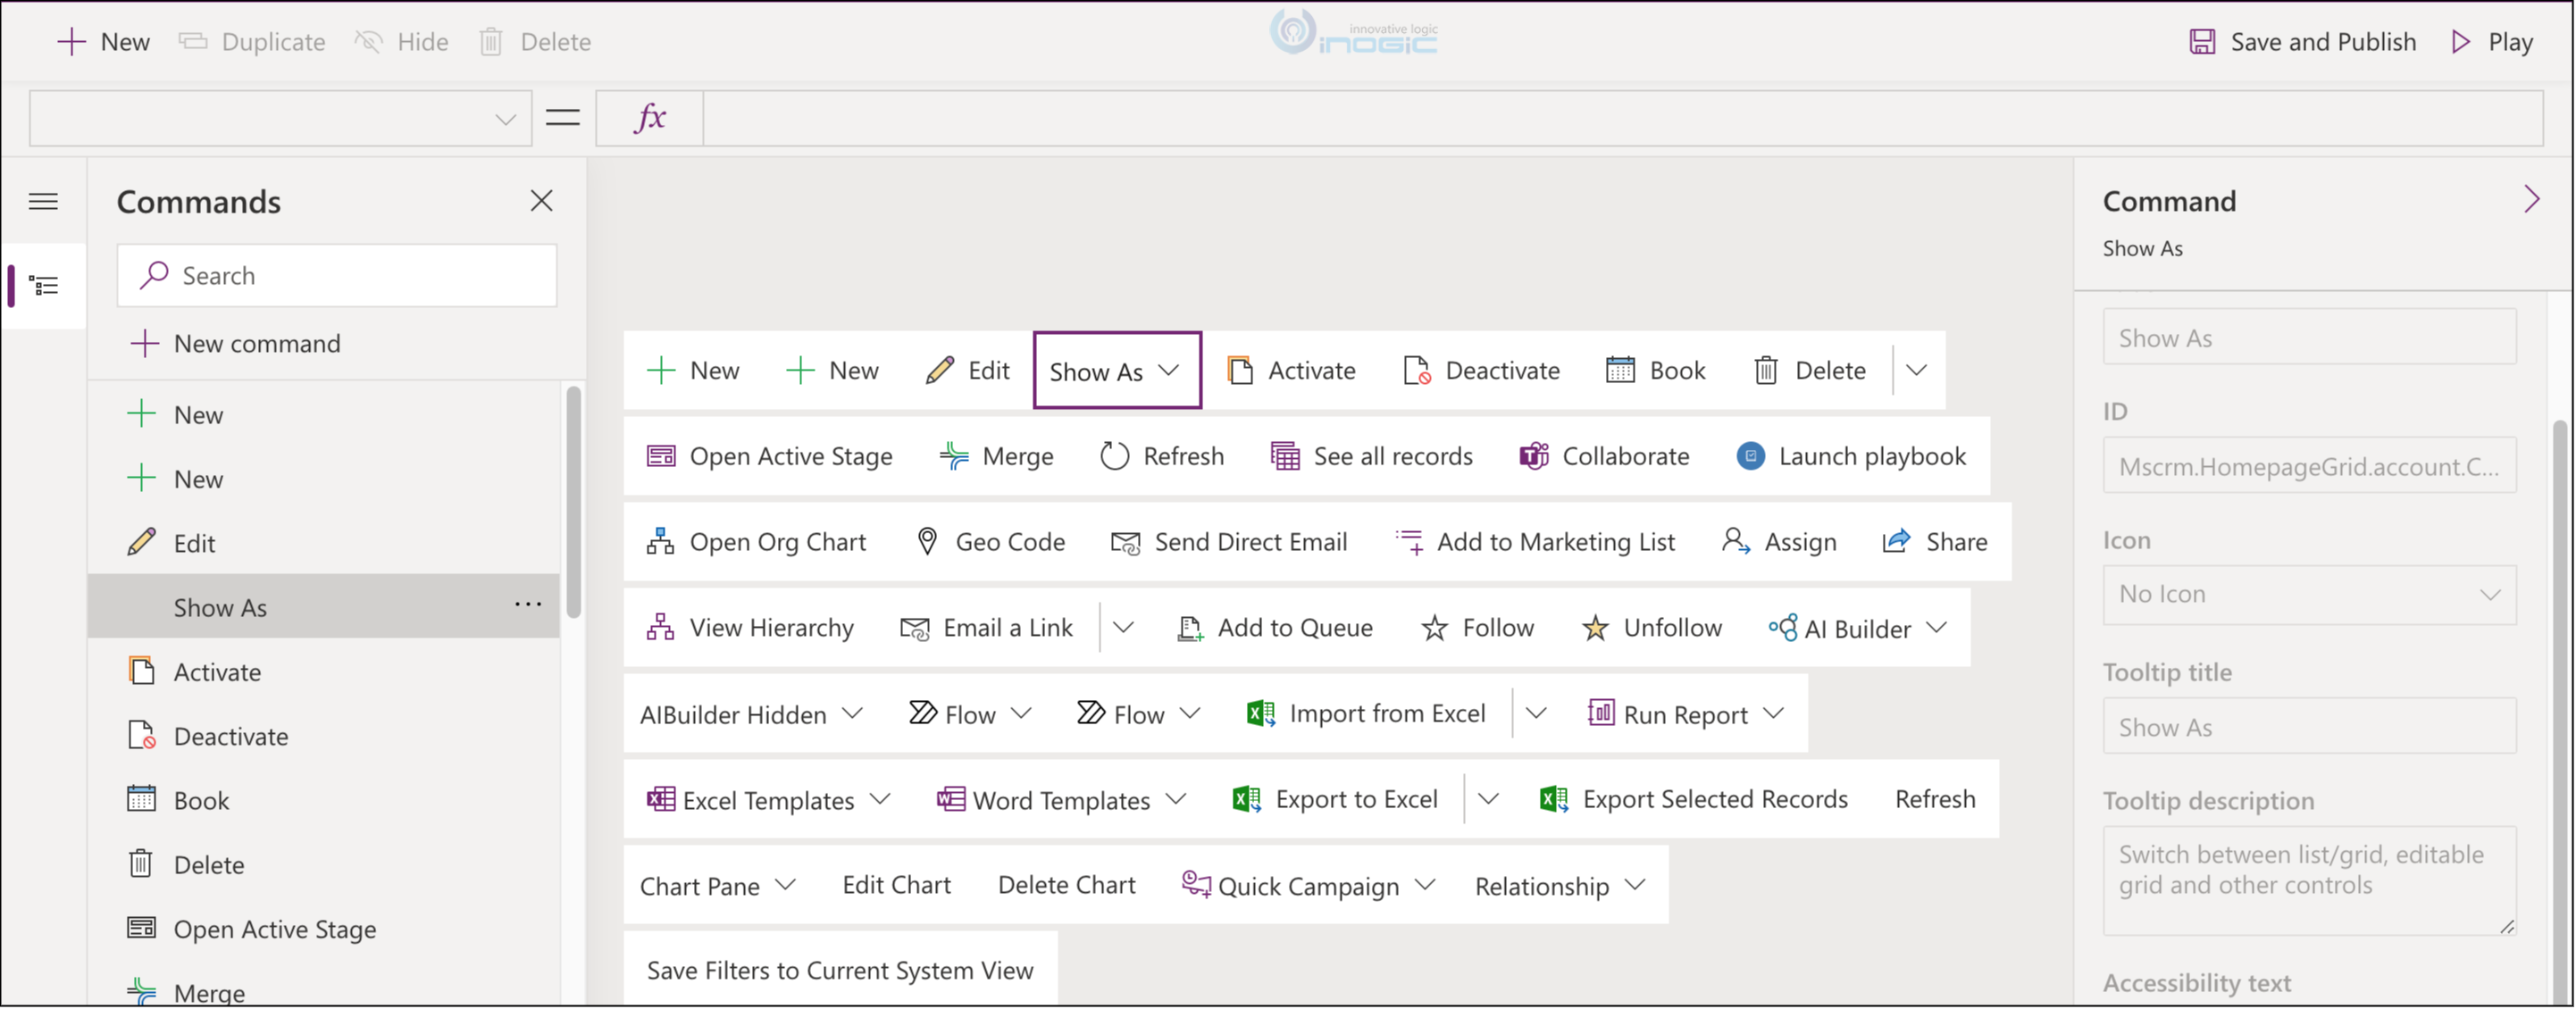
This brings up the visual designer.
Currently you are not allowed to edit any of the system command buttons including hiding the system buttons.
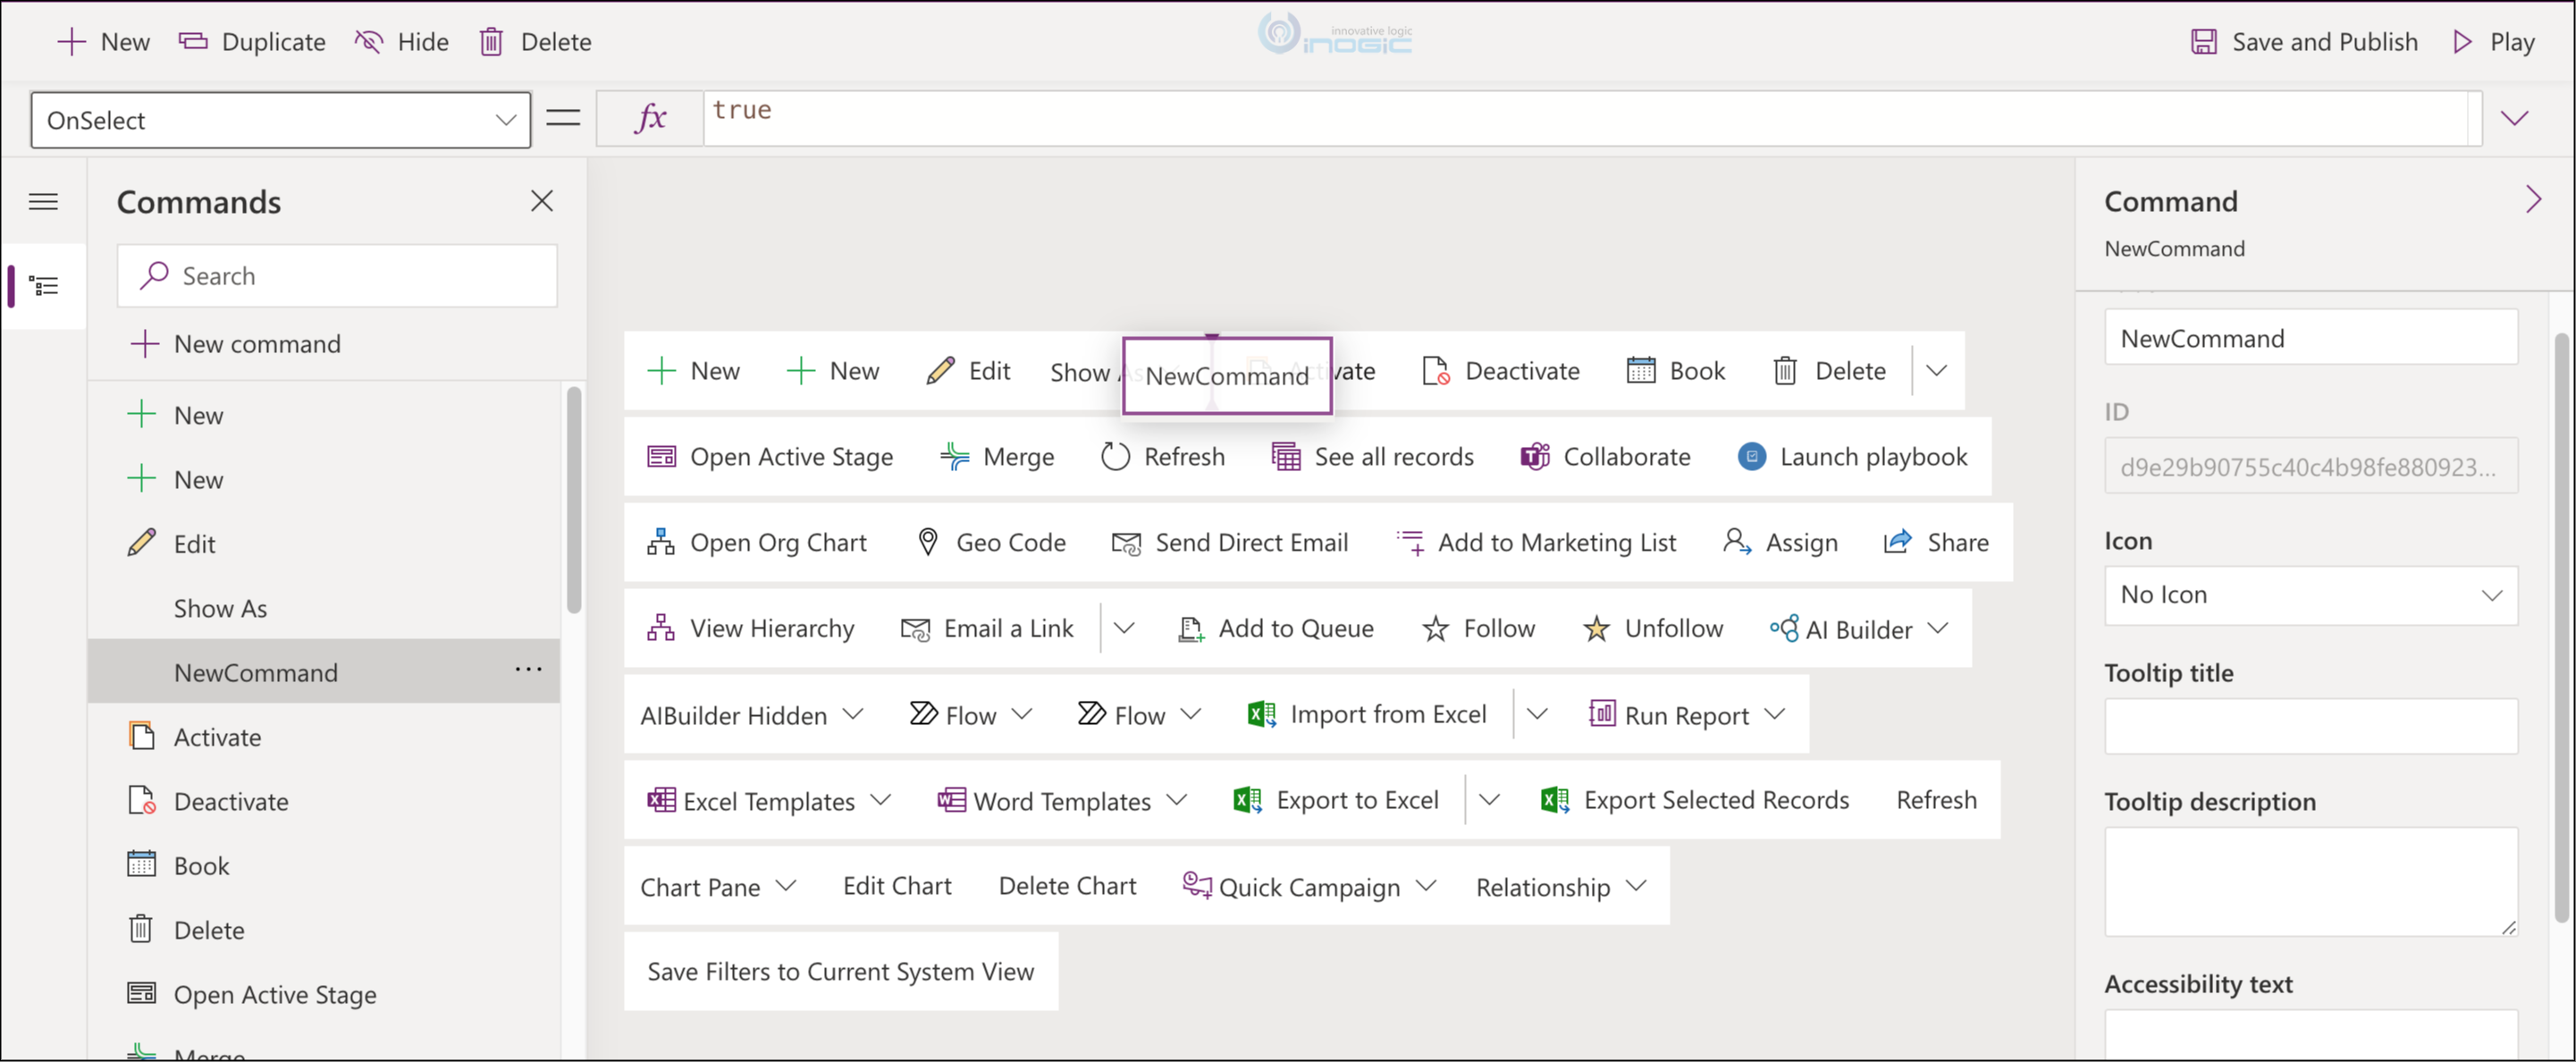
Click + New Command to add a new button.
You can drag and drop the button to position it where you want in the ribbon bar.
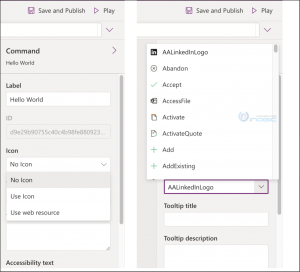
Choose an inbuilt icon or a custom webresource for the icon image. Good to see, easy to use inbuilt icons being available for quick selection. This ensures custom apps and customizations now provide the same visual experience as the first party apps.
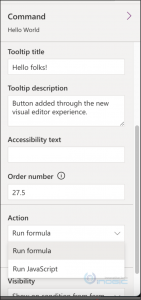
Next, set the tooltip for the command button and move to configuring the action to be performed by the button.
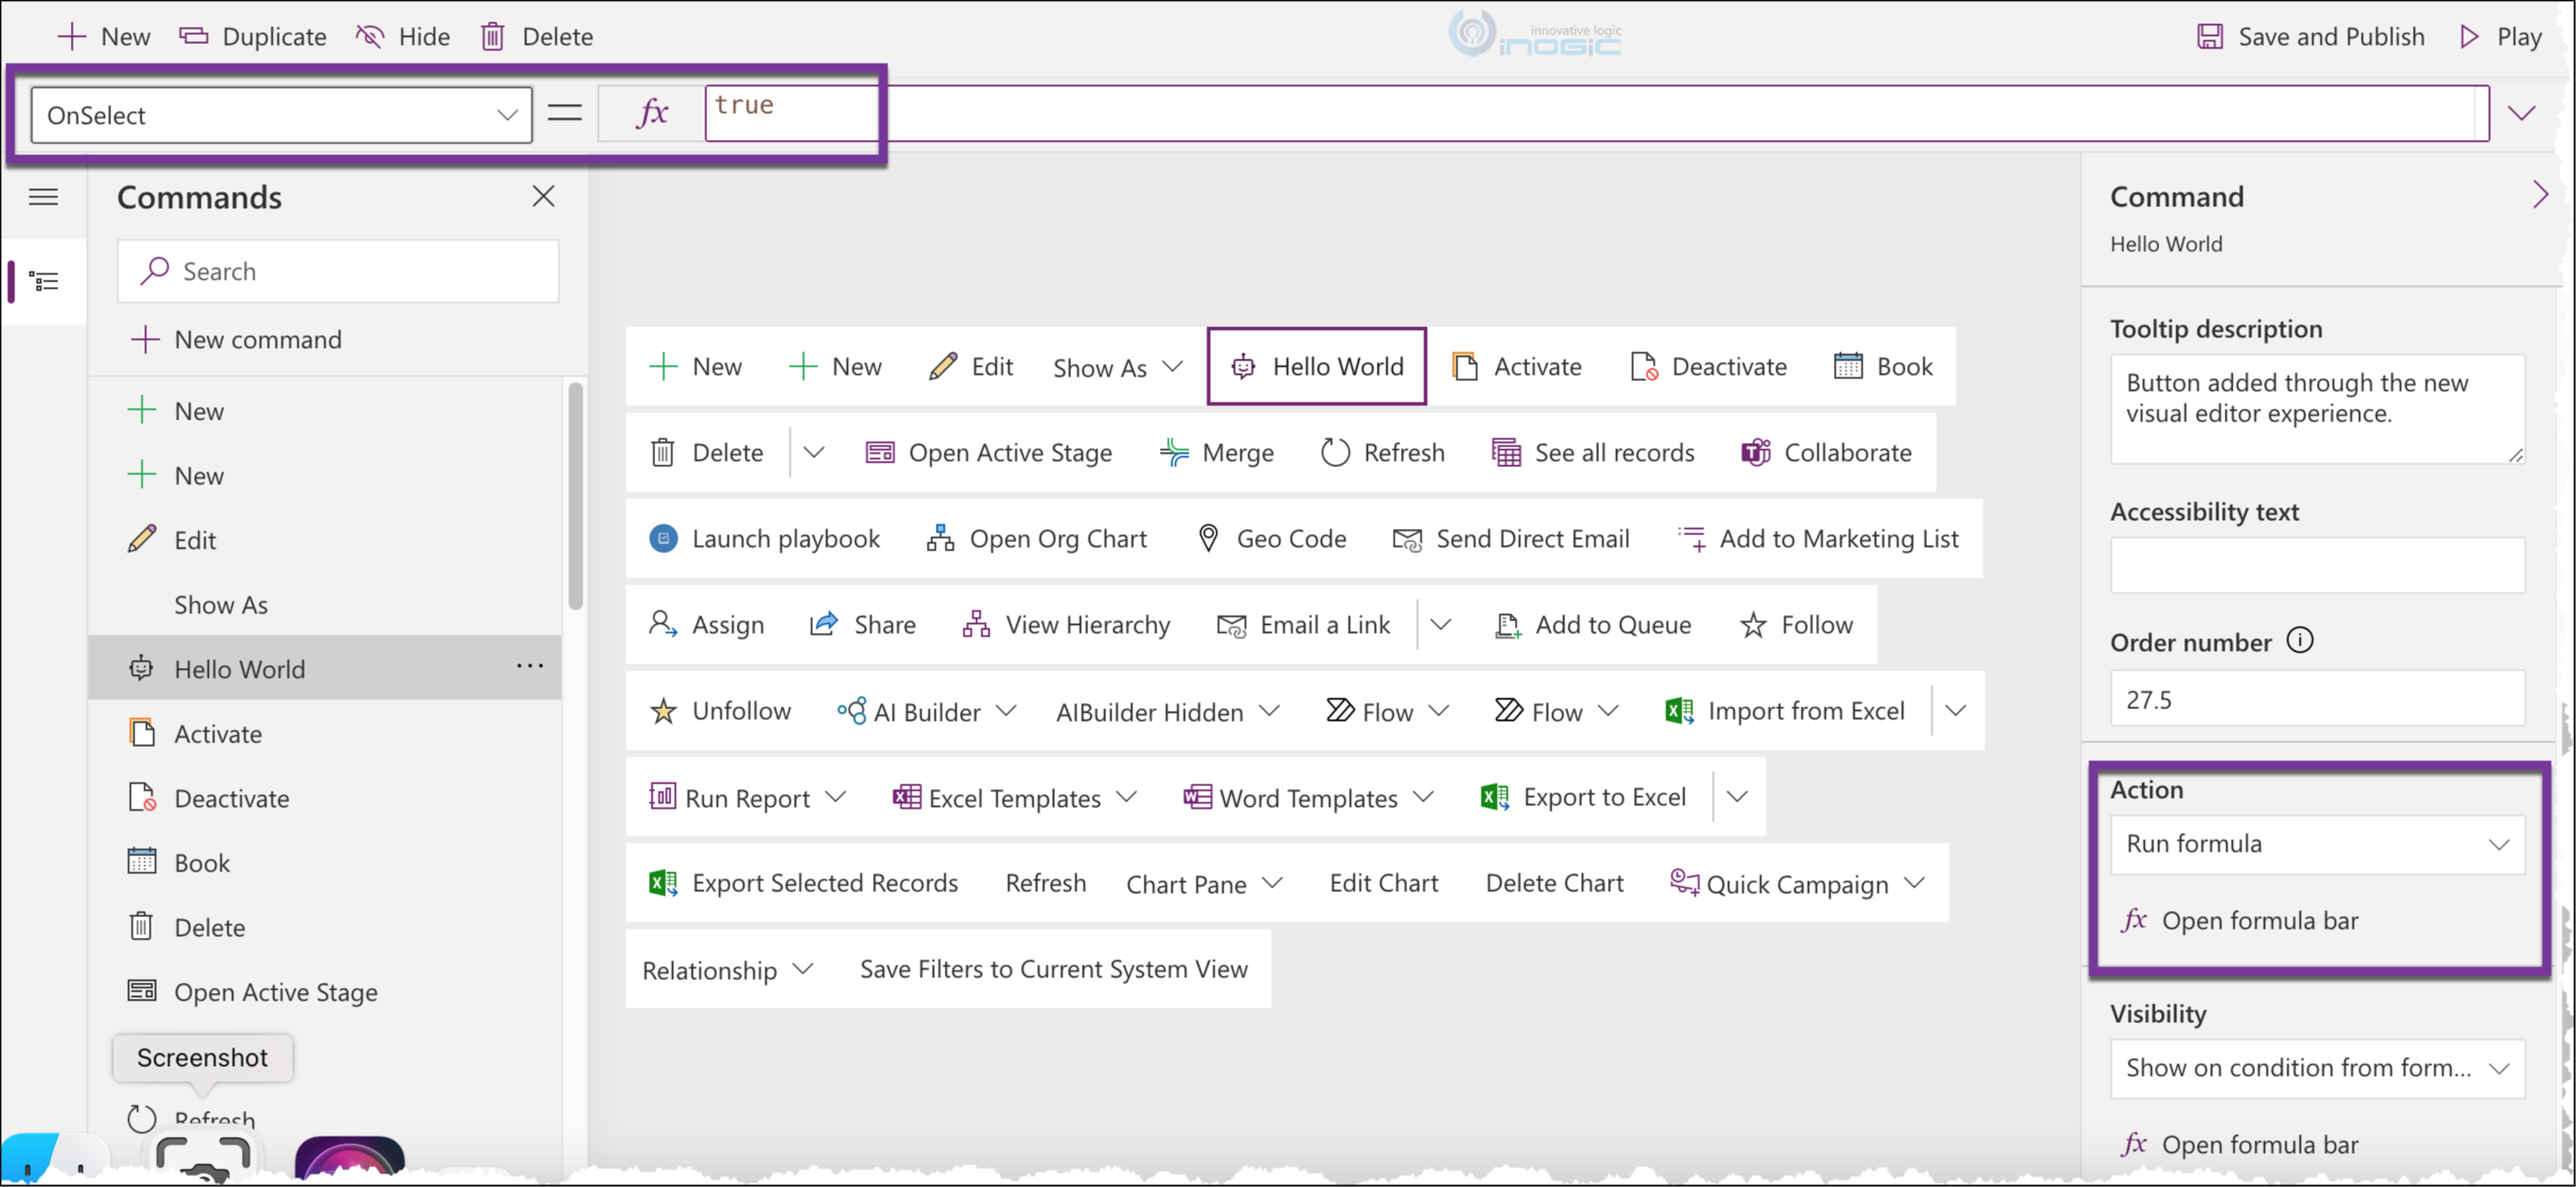
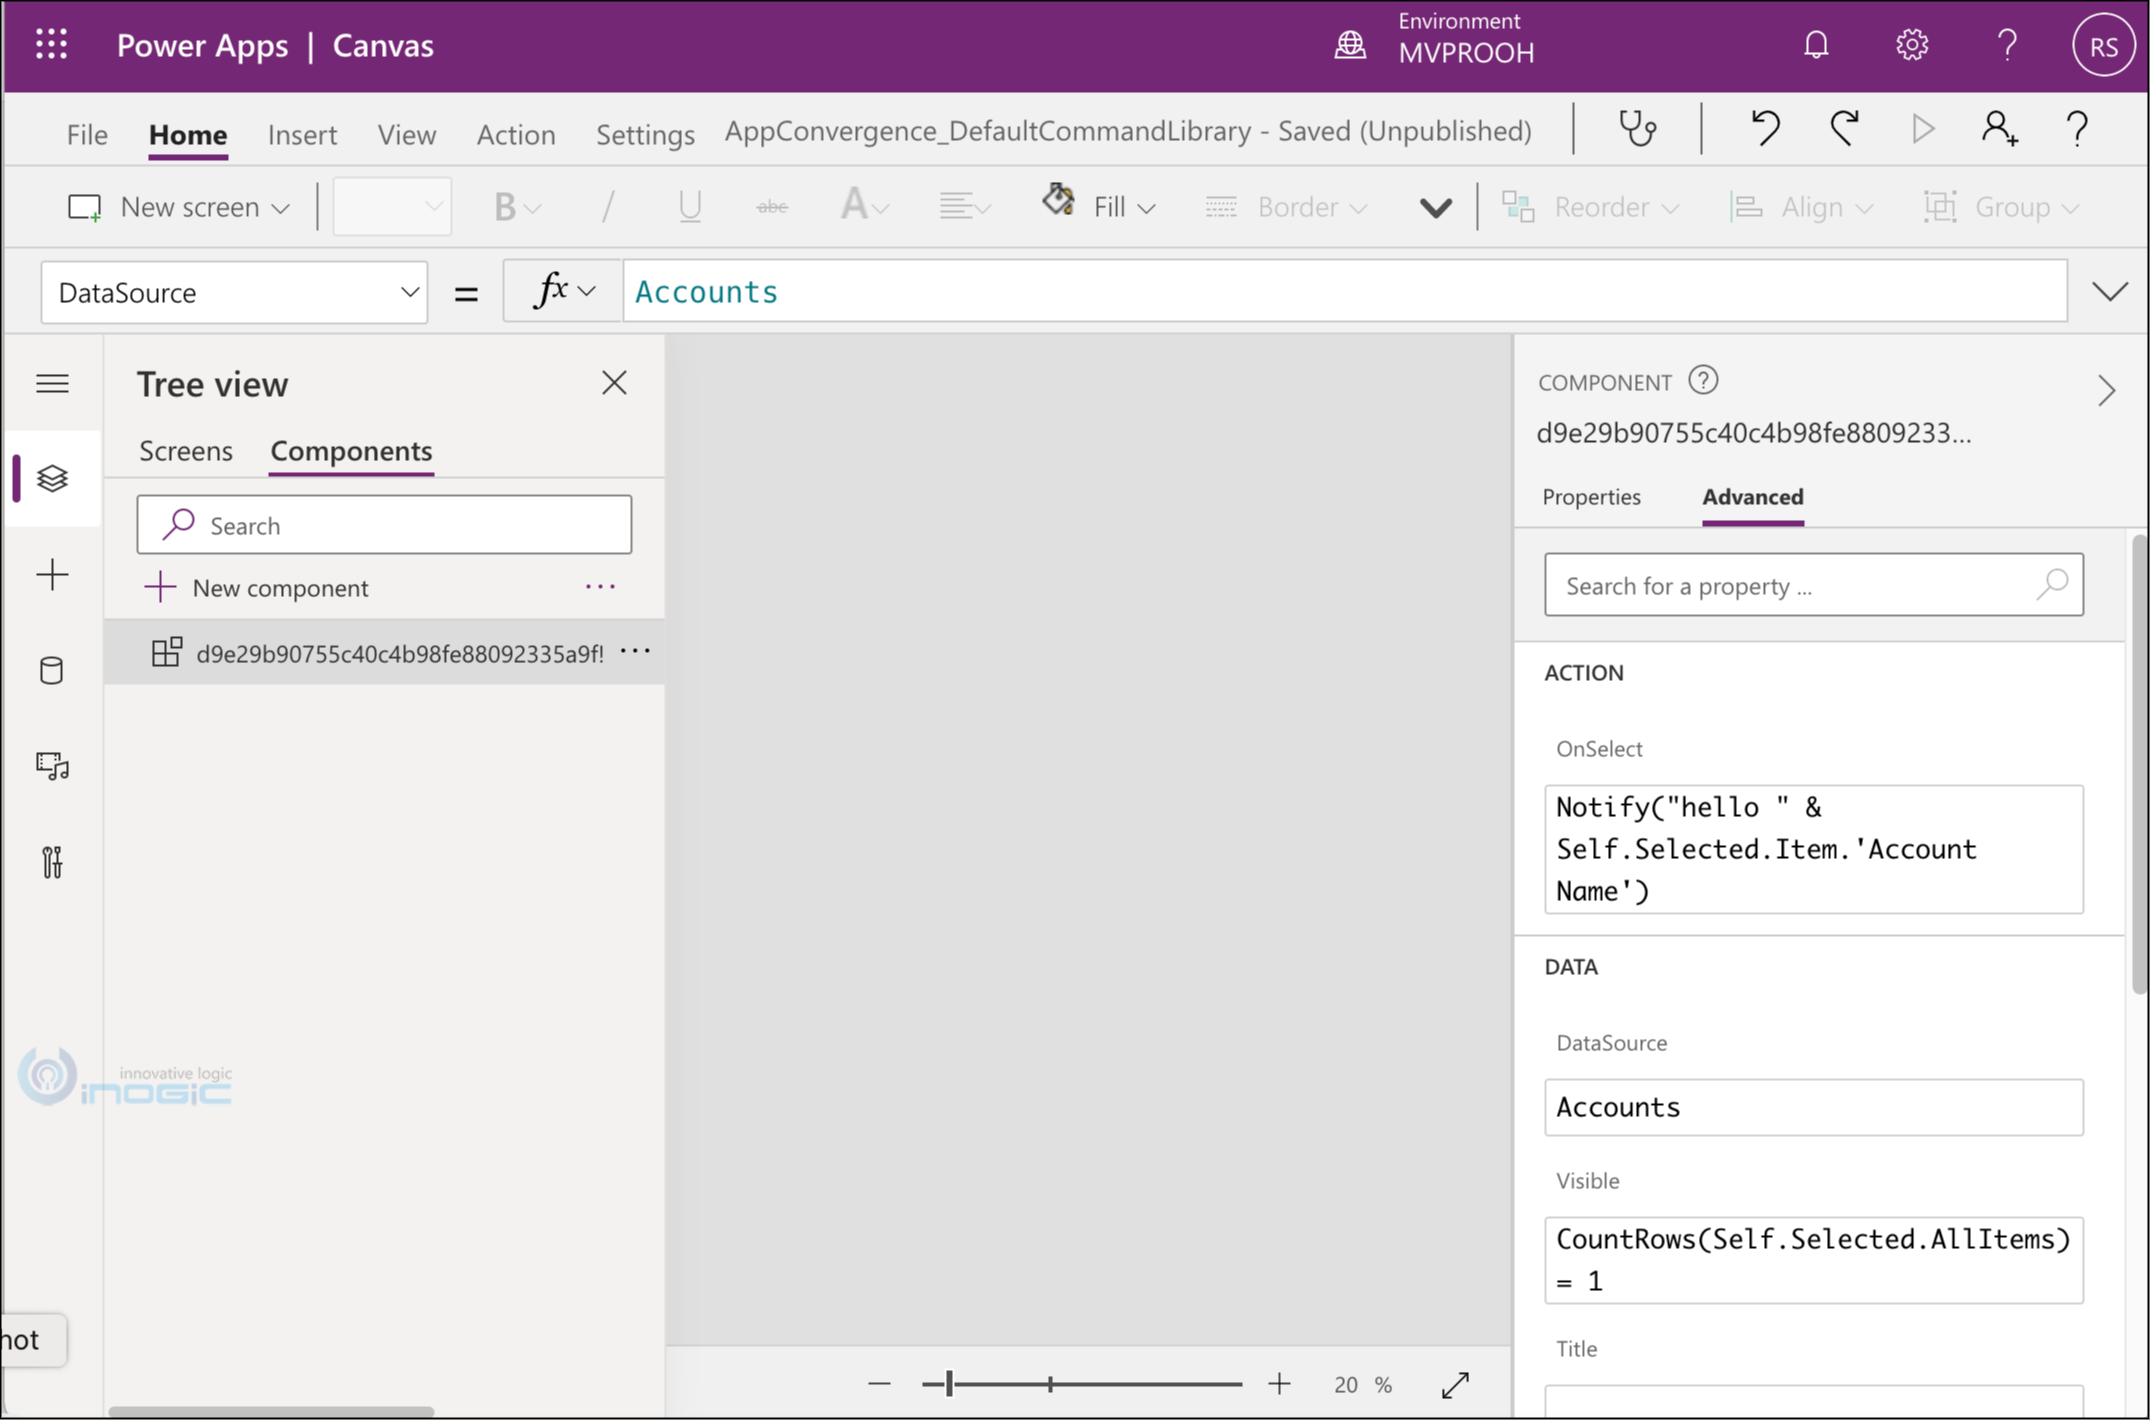
Let us explore the Run formula option first. Click on the open formula bar to notice the formula bar similar to the one we see with the canvas apps designer show up with the OnSelect event selected.
You can now type your PowerFx formula in the formula bar as the action to be performed when this button is clicked.
To check the commands/functions available for model driven app command bar within Power Fx read this.
For this walkthrough, I added a very simple notification command.
The selected property includes Item and AllItems with Item being the selected record in case only one record from the view was selected and AllItems for all the rows selected from the grid.
What this command does is show an App level notification bar with the name of the selected record.
You are also allowed to run javascript function from your webresource libraries.
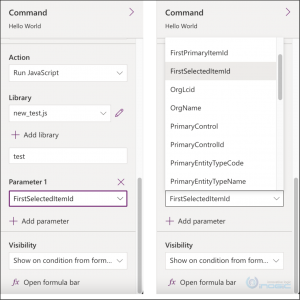
To use a javascript function set the following properties:
Library – The javascript webresource that contains the function
Function name – Name of the function within the library to execute.
Parameter – List of parameters to be passed to the function. You have access to predefined parameters as shown below:
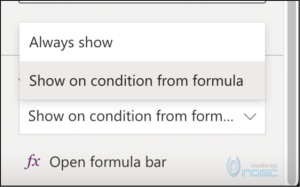
Visible property – You are often required to conditionally show the button. You could do this by using the Show on condition from formula
Now this one only includes support for Power Fx formula. You are not allowed to set the javascript function here.
The button will be shown only if 1 record from the view is selected.
When you run this app now, initially the button is hidden, when you choose one record, it shows up and the moment you choose another it is hidden again.
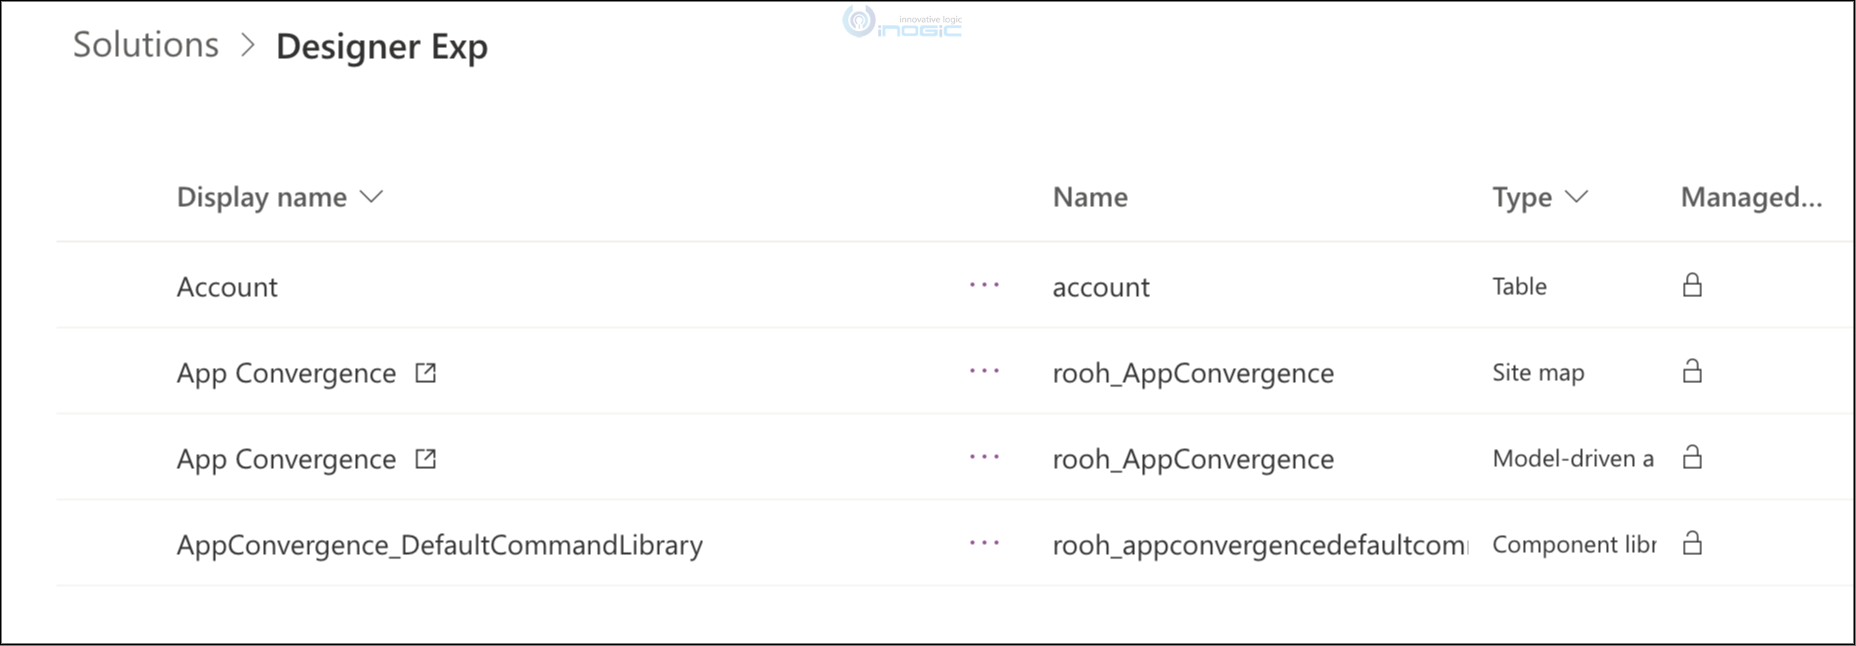
If you go back to your solution from where you started the app designer, you will notice the following components auto added to the solution
The Power Fx expression that was written for the command button action is converted to a component library. If you click on the ellipsis and choose to edit this library, it will open up in the canvas designer.
You can go ahead and make your edit here and save and publish for it to reflect back in your app. I modified the message from Hello to hi and here is the result.
Go ahead and export the solution. Unpacking the solution results in the following:
The commands are packaged as appactions and a canvas app with .msapp extension
Conclusion
Presently, the platform will continue to support buttons added through the new designer as well as the old Ribbon editors.
And we still need the Ribbon Workbench for some of the commonly used operations that are currently not supported through this new designer.
One Pic = 1000 words! Analyze data 90% faster with visualization apps!
Get optimum visualization of Dynamics 365 CRM data with –
Kanban Board – Visualize Dynamics 365 CRM data in Kanban view by categorizing entity records in lanes and rows as per their status, priority, etc.
Map My Relationships – Map My Relationships – Visualize connections and relationships between Dynamics 365 CRM entities or related records in a Mind Map view.

