Exploring the capabilities of Copilot Studio within Microsoft Dynamics and Power Platform opens up new avenues for enhancing business application development. A critical aspect of this process involves constructing intricate data models that often include multiple tables. The introduction of the innovative ‘Create New Tables (Preview)‘ feature in Copilot Studio transforms this procedure by enabling the seamless creation and visualization of data models through an intuitive Entity Relationship Diagram (ERD) view. This blog post delves into how this feature significantly boosts efficiency and precision in crafting robust data models, thereby maximizing the potential of Microsoft Dynamics and Power Platform to meet diverse business needs.
This innovative feature enables seamless data integration from diverse sources such as natural language inputs, Excel files, and SharePoint lists. Users can easily manage and manipulate data with a straightforward drag-and-drop interface.
With the help of Copilot, this feature allows you to create multiple tables and relationships in the ERD view.
Steps to Create and set up the new tables in ERD view:
Step 1: Enable Copilot(preview) Feature
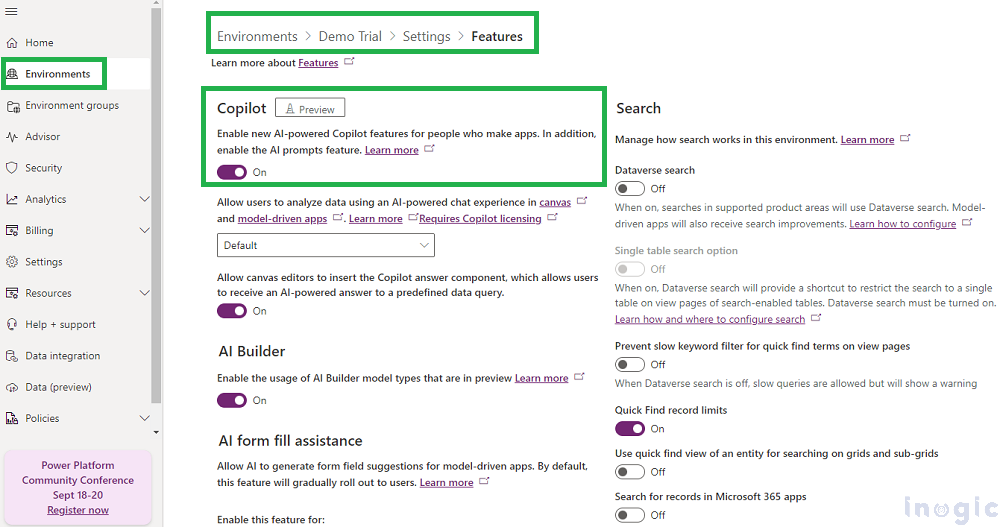
1. 1 Sign in with your Microsoft Dataverse:
- Move to the Power Platform Admin Center.
- Select the environment where you want to enable features: Settings → Features → Enable Copilot Preview Feature for your environment.
1.2 Activate the New Data Experience:
- Turn to the Power Apps Home Page for the selected environment.
- Enable the ‘Try the new data experience’
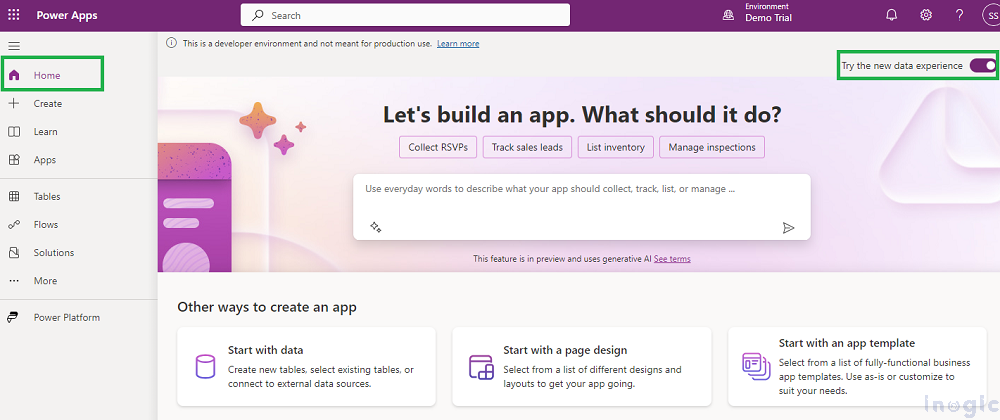
- Once enabled, you can access the new data experience through various pathways, such as the home page, tables page, and app designers—available wherever you can create new tables.
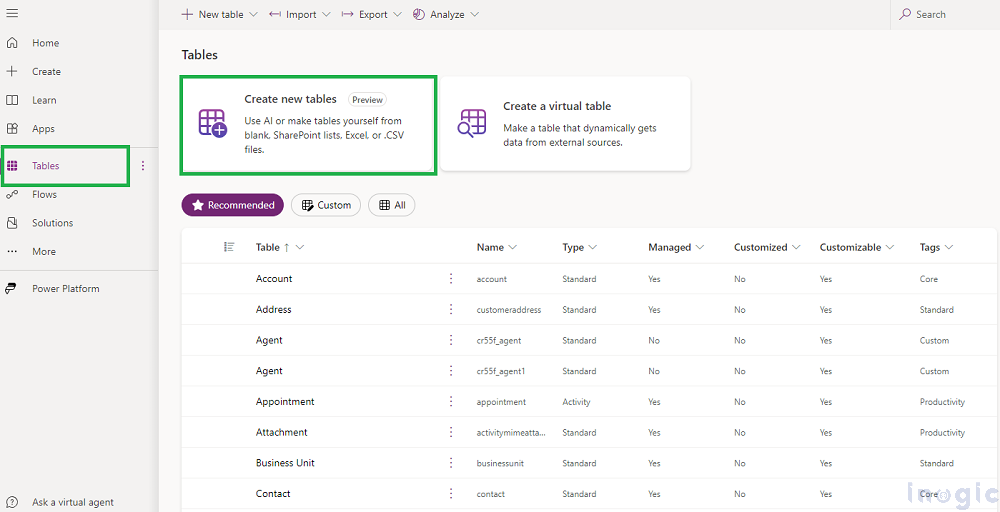
Step 2: Create tables with Create new tables(preview) feature in ERD view:
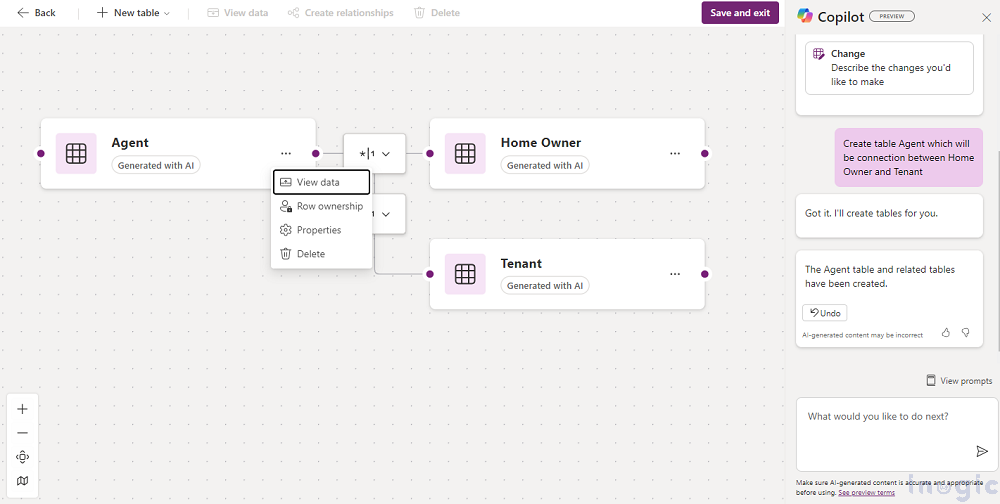
2. 1 Create a table in the ERD view with Copilot
- You can create tables by describing them to Copilot. Copilot will generate one or multiple tables with relationships based on your instructions. Furthermore, you can manage column additions and removals by providing descriptions to Copilot. Below is the screen clip for reference,
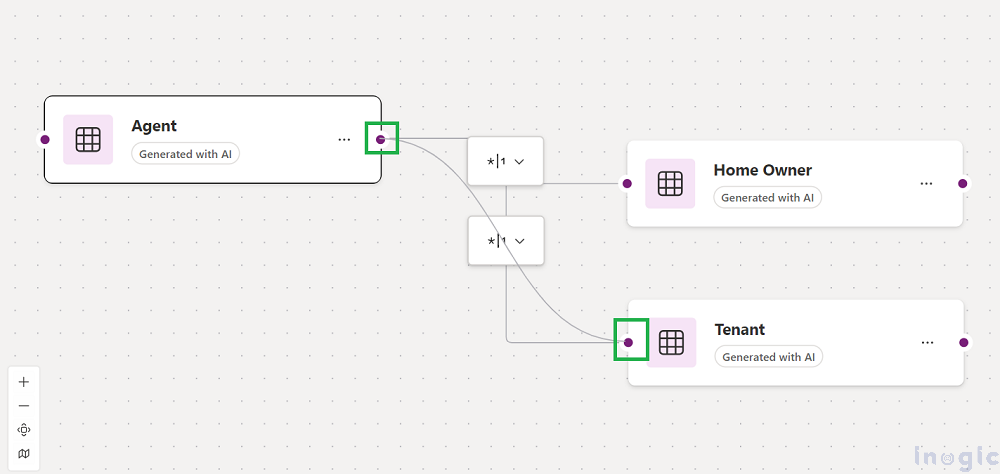
- After creating the table, the ERD view will open, allowing users to see the tables, their columns, data, and relationships, as shown below,
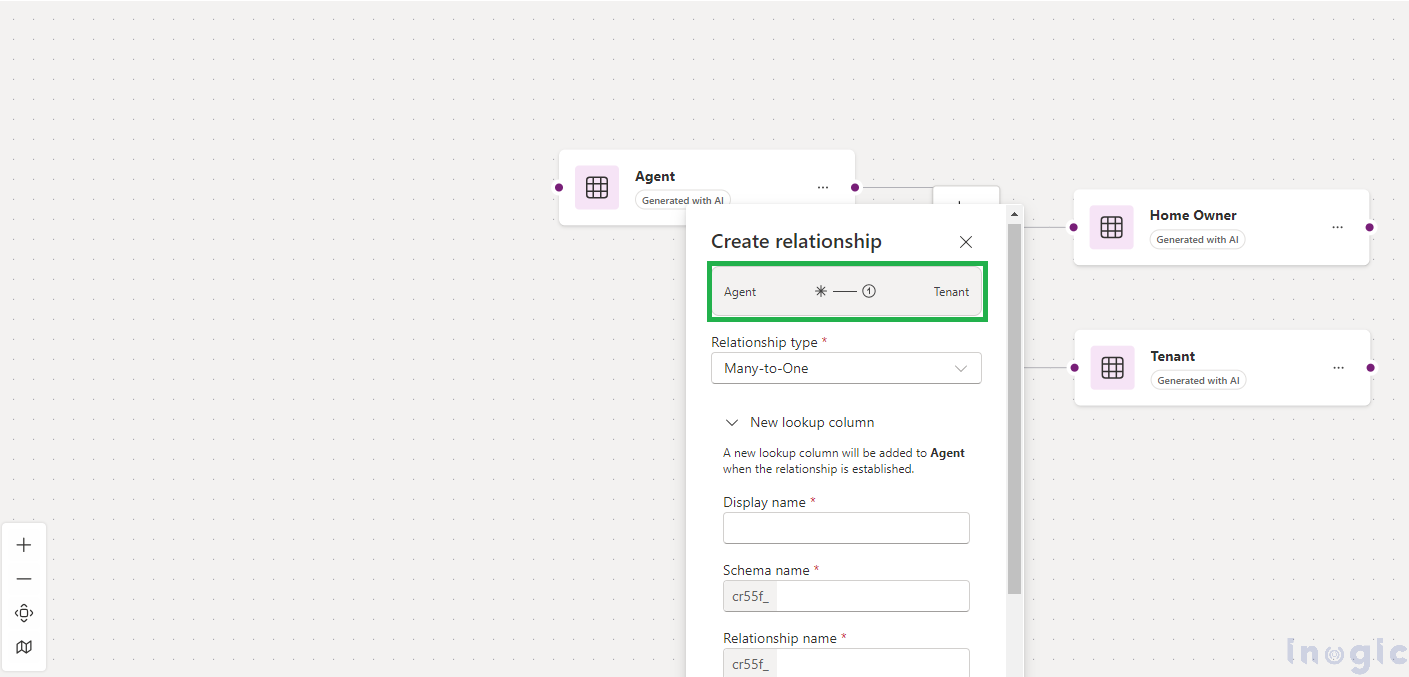
- You can create relationships between tables in ERD by simply drag and drop.
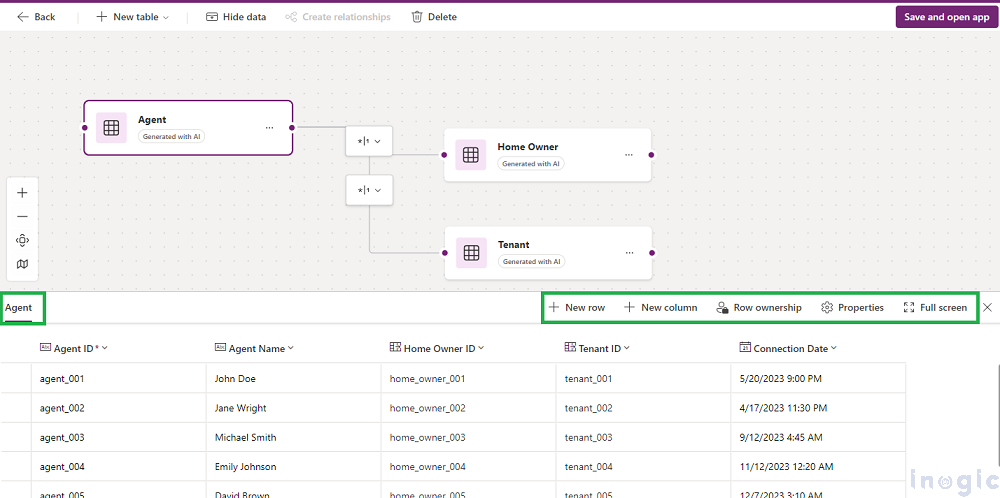
Step 3: Edit table properties with the Data drawer
- Beyond the ERD view, the new data experience includes a Data drawer feature, which lets you simultaneously view the schema and a tabular representation of your data model.This dual-view setup allows for direct editing of table elements such as columns, rows, and table properties.
Conclusion:
Integrating Copilot with the ERD view for data models revolutionizes database design and management for developers and data professionals alike. This integration automates table creation and manipulation, offers contextual assistance, and provides a seamless drag-and-drop interface, significantly boosting productivity and ensuring precision in data handling.
Experience the power of Dynamics 365 and Power Platform with Copilot!
Stay ahead with the latest updates in Copilot, integrating Microsoft Copilot into your developments. Connect with us at crm@inogic.com for personalized AI-enabled solutions tailored to your business needs.