Introduction:
The Sales Accelerator in Dynamics 365 CE provides a digital selling customized experience to the sales team. Using this feature, sales team can prioritize customer lists and create worklists that help in making every communication successful.
Recently when I was setting up “Sales Accelerator” in Dynamics 365 CE 2021 wave2 version, I came across a couple of enhancements that would make the sales team’s life easy:
- “Go to seller experience” feature: a hyperlink option that will quickly navigate you to “Sales Accelerator” work items UI under sales area.
- “Sales acceleration reporting” PREVIEW feature: a feature that uses AI to display KPIs and metric charts for all sequences that are related to leads and opportunities over the months.
It provides real-time analytics based on data and predictive information that can help the sales manager in accelerating the sales performance of the team. It leverages reporting capability to filter the data based on specific time periods (Weekly, Monthly Yearly), entity type, sequence name, sequence owner, seller, and territory.
To explore this feature, firstly make sure that the Sales Insight license is enabled in the organization. If you have not enabled it yet then refer to this doc.
Now, let’s start with the actual demonstration of each feature.
-
“Go to seller experience” feature for quick navigation:
While setting up “Sales Accelerator” there is “Go to seller experience” hyperlink which is now available as shown below:
You can navigate to “Sales Insights setting” –> under “Sales accelerator” –> click on “Setup” –> at the right-hand side you will find “Go to seller experience” hyperlink. By clicking on it you will be quickly navigated to “Sales Accelerator” section where all the work items are listed for sales representatives.
What is the use?
As we all know, sales representatives spent most of the time on work items that are prioritized for them by the sales manager through the defined sequence. So this feature is really useful as navigation has now become easy with just one click.
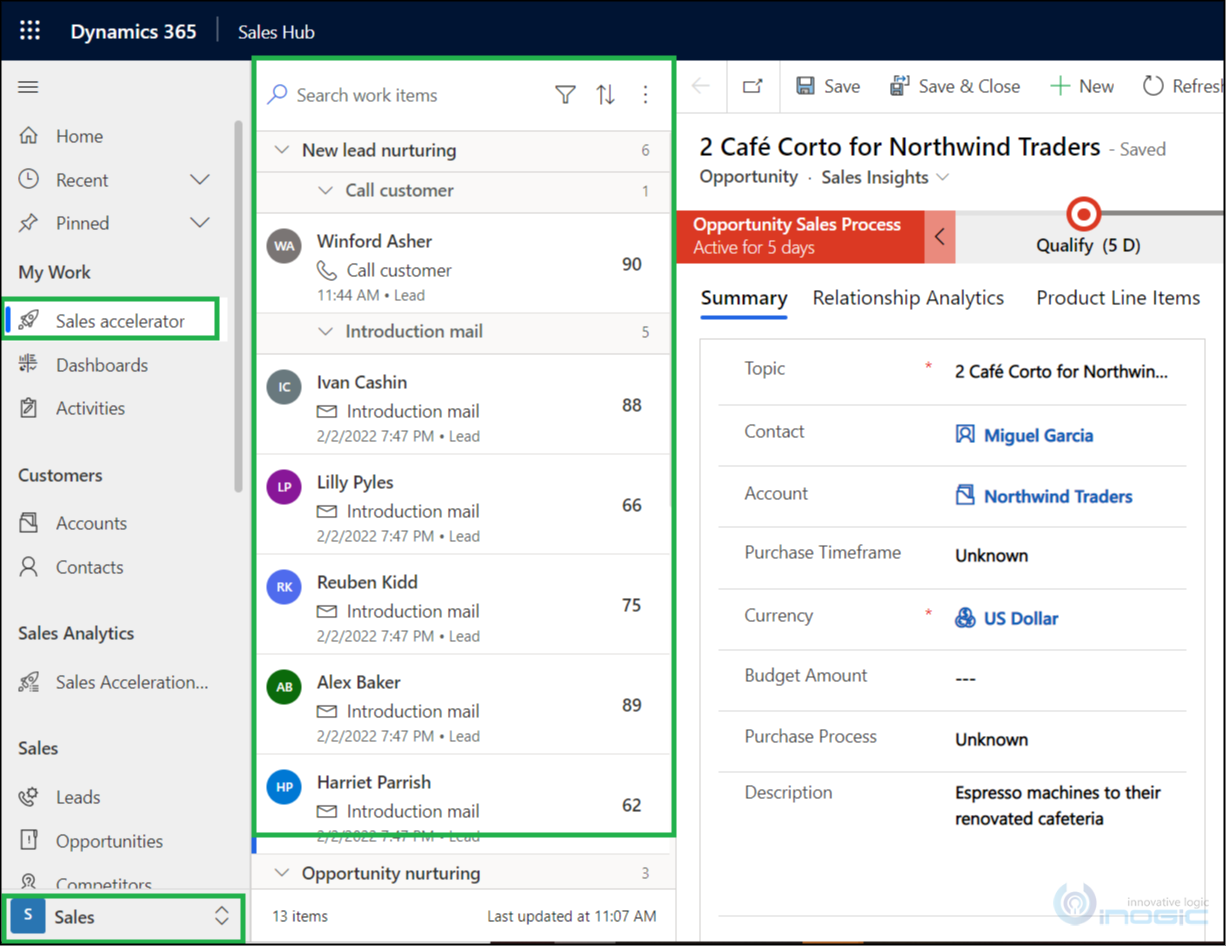
Before this option, after setting up Sales Accelerator to see the work items that are prioritized, Sales representatives had to navigate to ”Sales” area–>”My work”–>”Sales Accelerator” as shown below:
But now in just one click from within the setup configuration page they will be directly navigated to the work items list.
-
Configuring “Sales acceleration reporting (preview)” feature:
By enabling “Sales acceleration reporting (preview)” feature you get a quick overview of lead and opportunity sequences that are defined in your organization.
This reporting feature lets you analyze metrics and key performance indicators (KPIs) which then the sales manager can keep watch upon and identify the area of improvement for increasing the sales growth.
You can follow the simple steps given below to configure this feature:
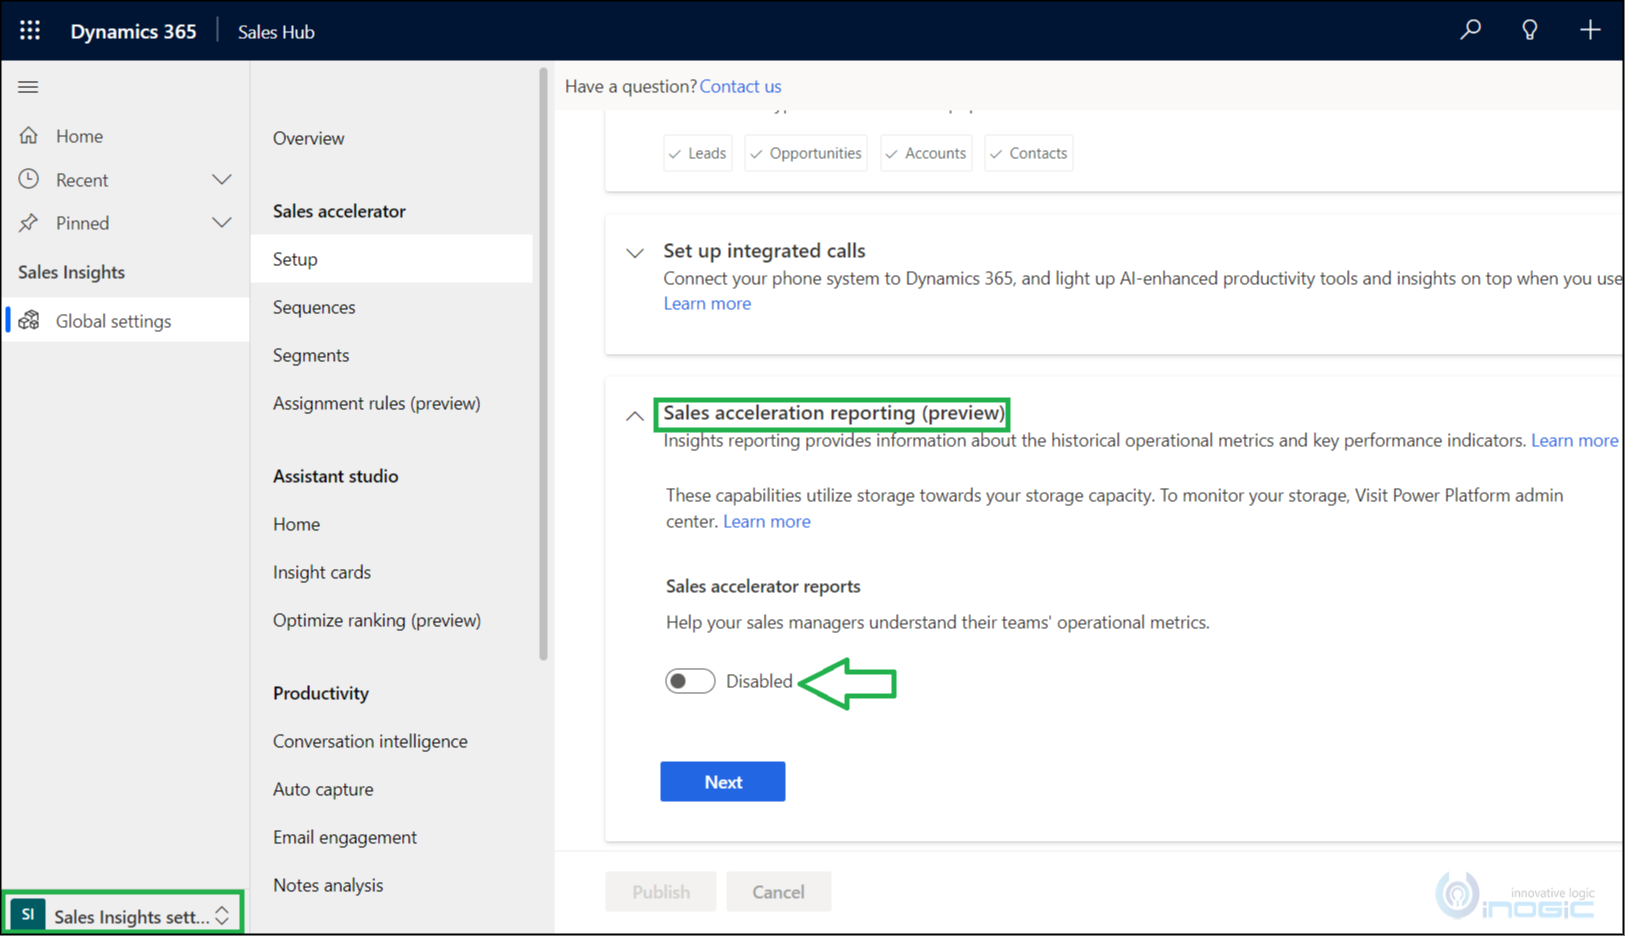
- Navigate to “Sales Insights setting” –> under “Sales accelerator” –> click on “Setup” –> when you scroll down, you will find “Sales acceleration reporting (preview)” option available.
By default, this feature is disabled as shown below. Just flip the control to enable it.
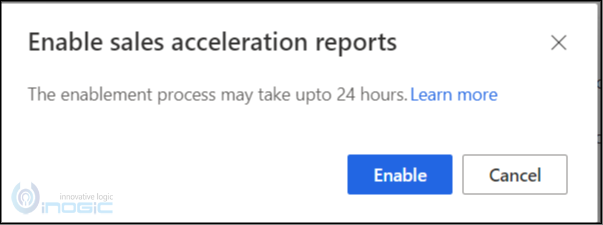
- While enabling, you will see with below pop up, click on “Enable” button to proceed:
After #2 step you need to wait for a few minutes to perform the #3 step. (It takes few minutes for this feature to be enabled and changes to reflect. It took me about 20-25 minutes and after that “Sales Analytics” had started appearing under the “Sales” area.)
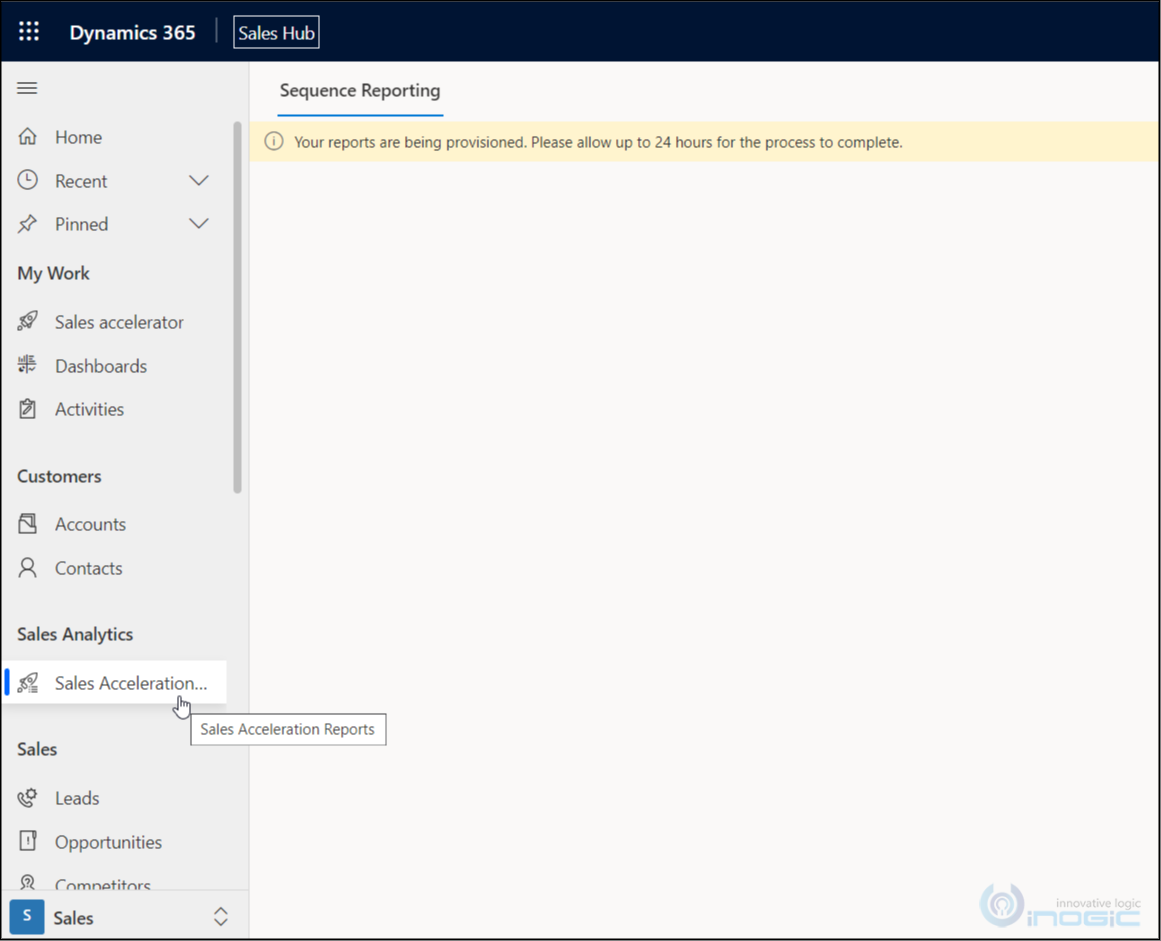
- Navigate to “Sales” area–> under “Sales Analytics” –> click on “Sales Acceleration Reports”. You will be now navigated to the “Sequence Reporting” page.
As the reports are being provisioned for the first time, the following message is shown:
After #3 step, you need to wait for few hours to let provisioning finished. (It takes a few hours for this feature to complete the provisioning process and changes to reflect. It took me about 6 hours.)
- Once provisioning is completed, data will start loading on the “Sequence Reporting” page.
KPI Summary Chart:
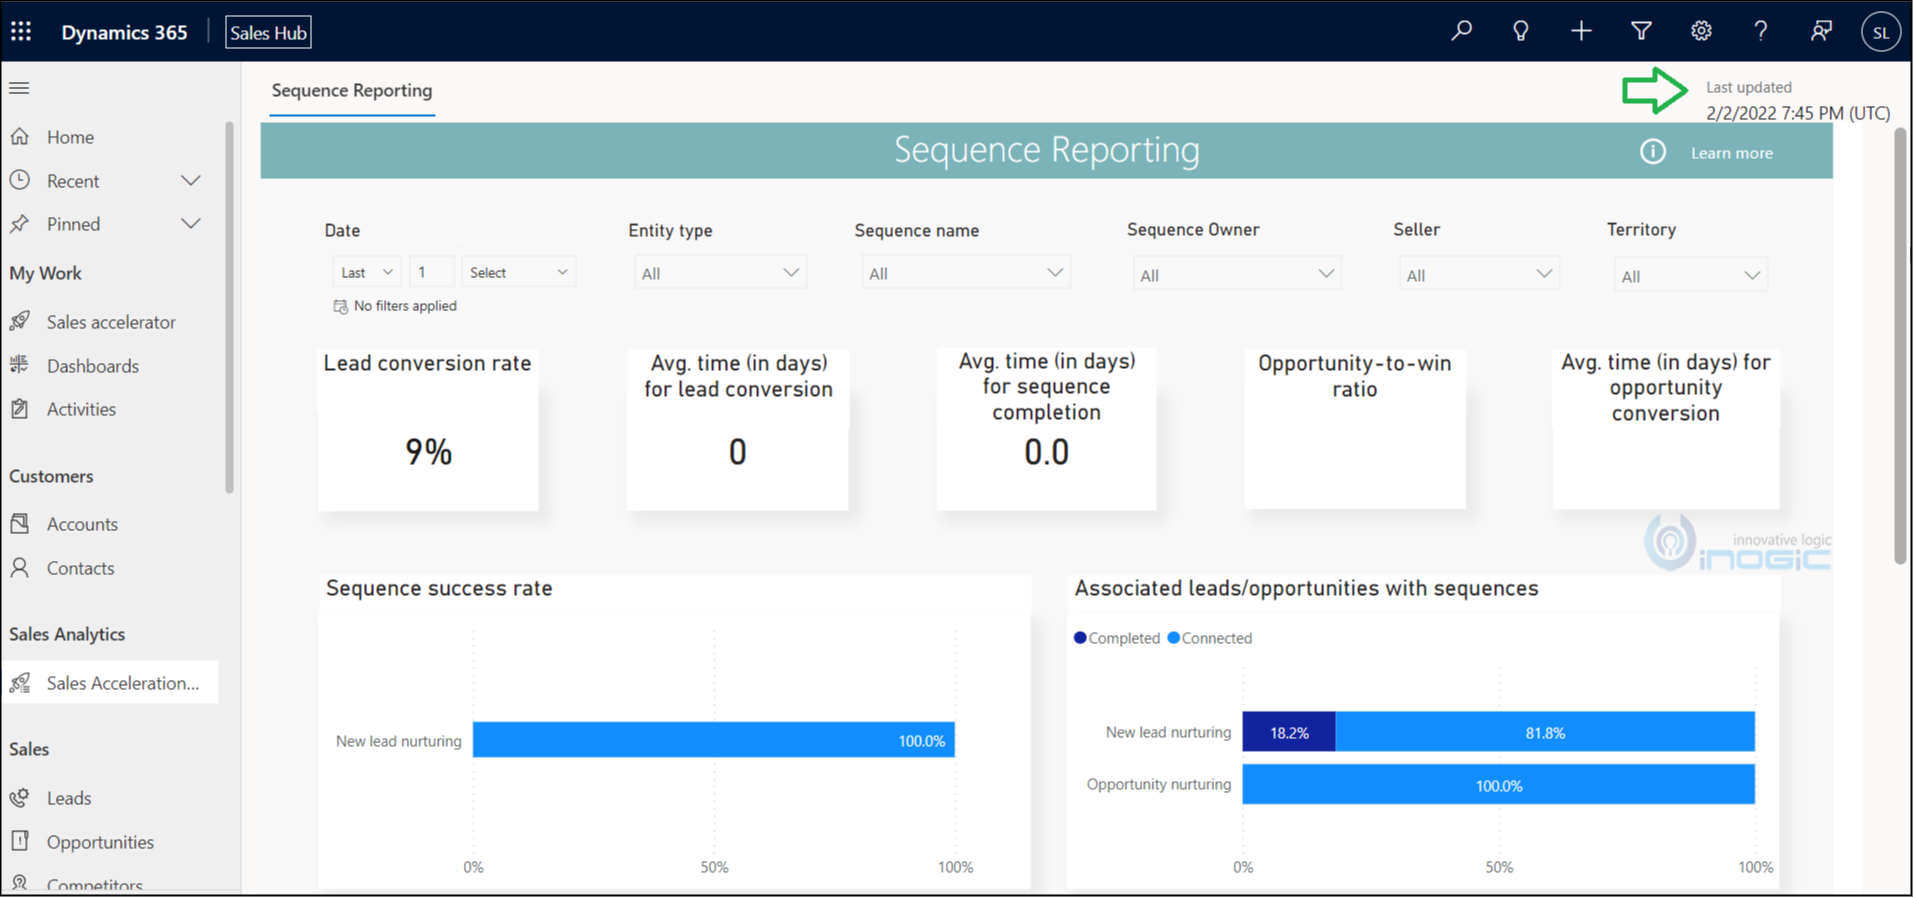
“Last updated” date: As shown in the below screenshot, on the top right-hand corner you will see the “Last Updated” date which shows when the page was updated last time.
KPI data that are displayed in the “Sequence Reporting” page shows KPI calculating factors like “Lead conversation rate”, “Avg. Time (in days) for lead conversation”, “Avg. Time (in days) for sequence completion”, “Opportunity-to-win ratio”, “Avg. time (in days) for opportunity conversation” etc.
Let us discuss one of KPI factor “Lead conversation rate” here.
Lead conversation rate: If you have sequence present for lead entity and if any of connected leads are converted into opportunity then it gets tracked here. In simple terms, it represents the success rate in percentage of how many leads are qualified that belongs to the “Lead” sequence.
You need to have valid data already present in the organization for values to appear in each KPI while reporting. For e.g. if you want the value to appear in “Lead conversion rate” KPI then leads that are connected to the sequence must be qualified and converted to opportunity.
Like the “Lead conversation rate” there are many other factors involved in KPI and Metric summary charts, you can refer to this doc for more details about other factors.
Metric Chart:
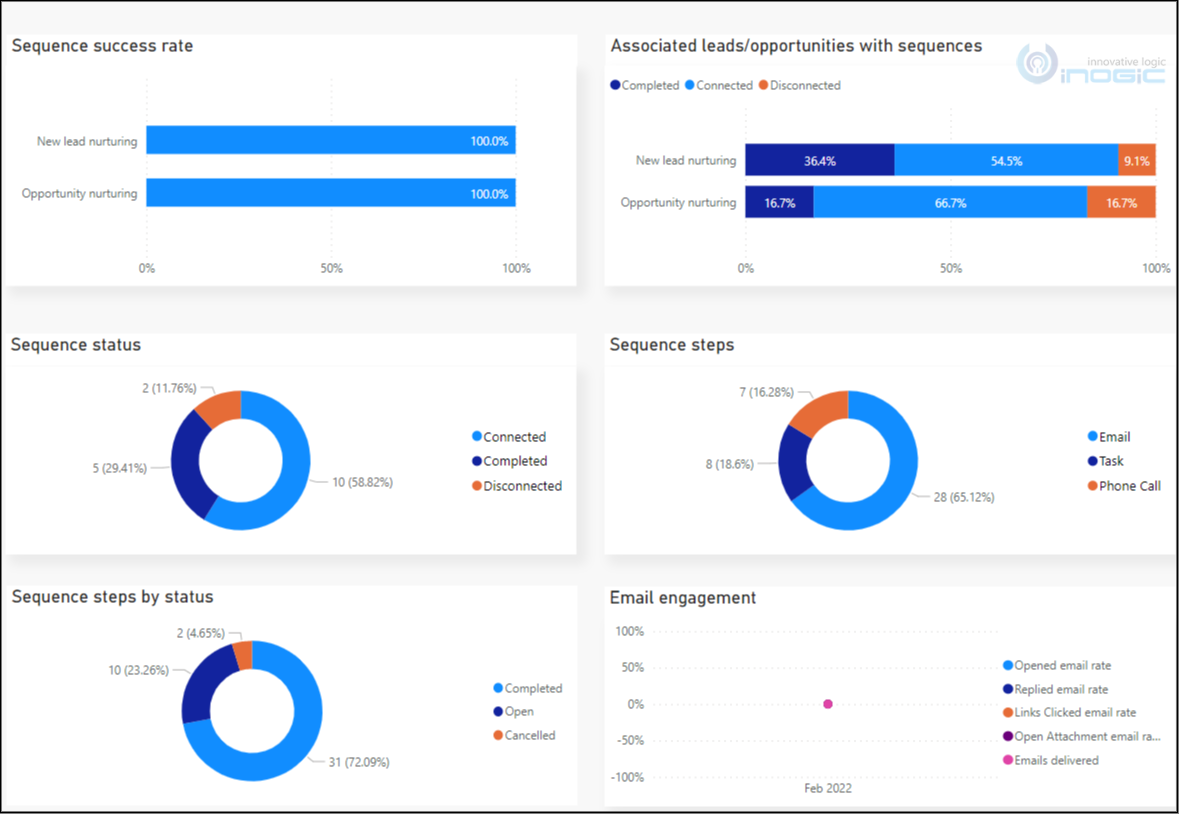
Along with the KPI summary chart, if you scroll down on the Sequence reporting page, you will find the Metric chart as shown below:
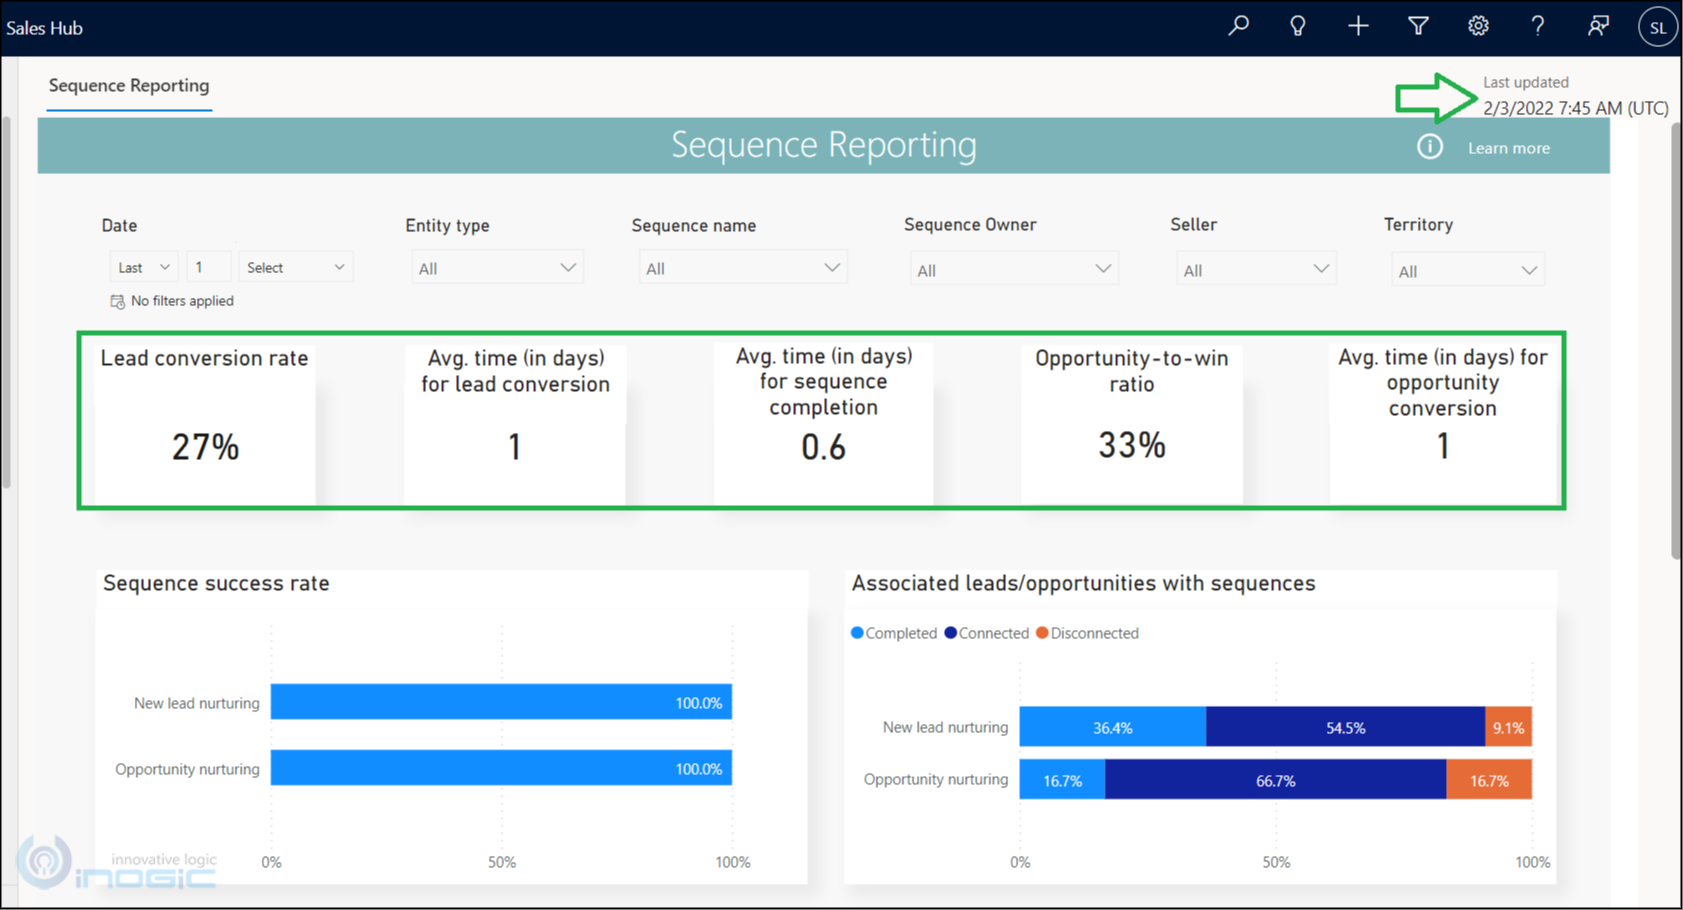
The “Last updated” date is refreshed every 24 hours and the recent data is loaded, as shown in the below screenshot. (It actually took 24 hours for this feature to update the sequence reporting, observe the Last updated date value highlighted below.)
NOTES:
- As of now, reporting only works for Lead and Opportunity entity sequences.
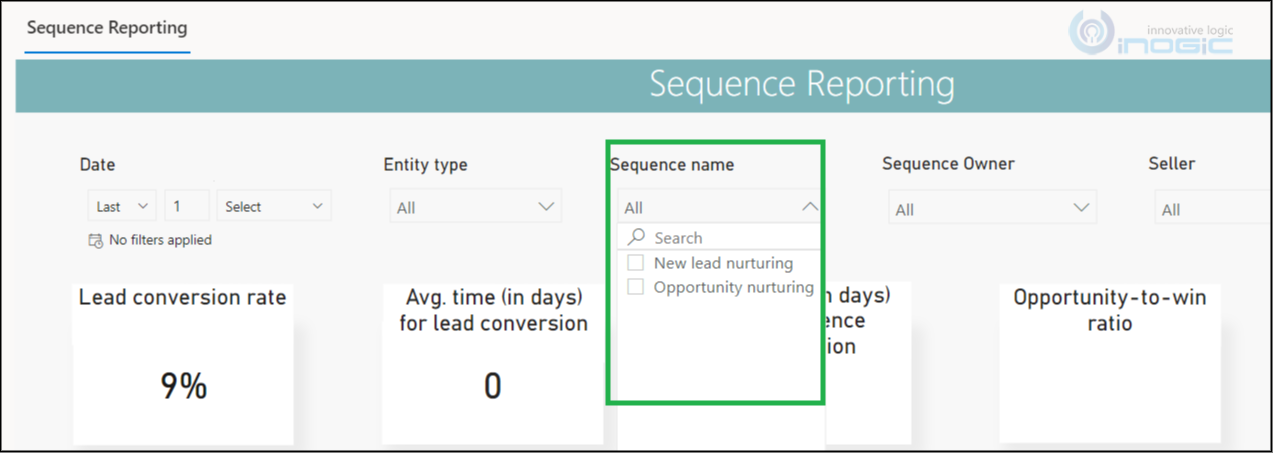
- By default report displays KPI for all sequences (that is Lead and Opportunity) however at any time you can use filtering and can filter the data by sequence. At any time, you can select the “Sequence Name” to filter the data as shown below:
Conclusion:
As illustrated above, while setting up Sales Accelerator in the organization sales managers can use this reporting feature. And with the help of KPI and Metric chart displayed in the report, they can identify areas of improvement and help sales team to be more productive.

