Introduction:
With lots of new enhancements introduced by Microsoft this year, Deal Manager is a gem for the sales team. This latest feature provides a new approach to easily handle opportunities in Dynamics 365 CRM. The Deal Manager Workspace can be customize and altered based on seller’s preferences.
How to Setup and Enable Deal Manager in our environment?
The System Administrator has to enable the preview for this feature, so that the Sales team can have access of the same.
You can access the Deal Manager from the Sales Hub App in App Settings Page.
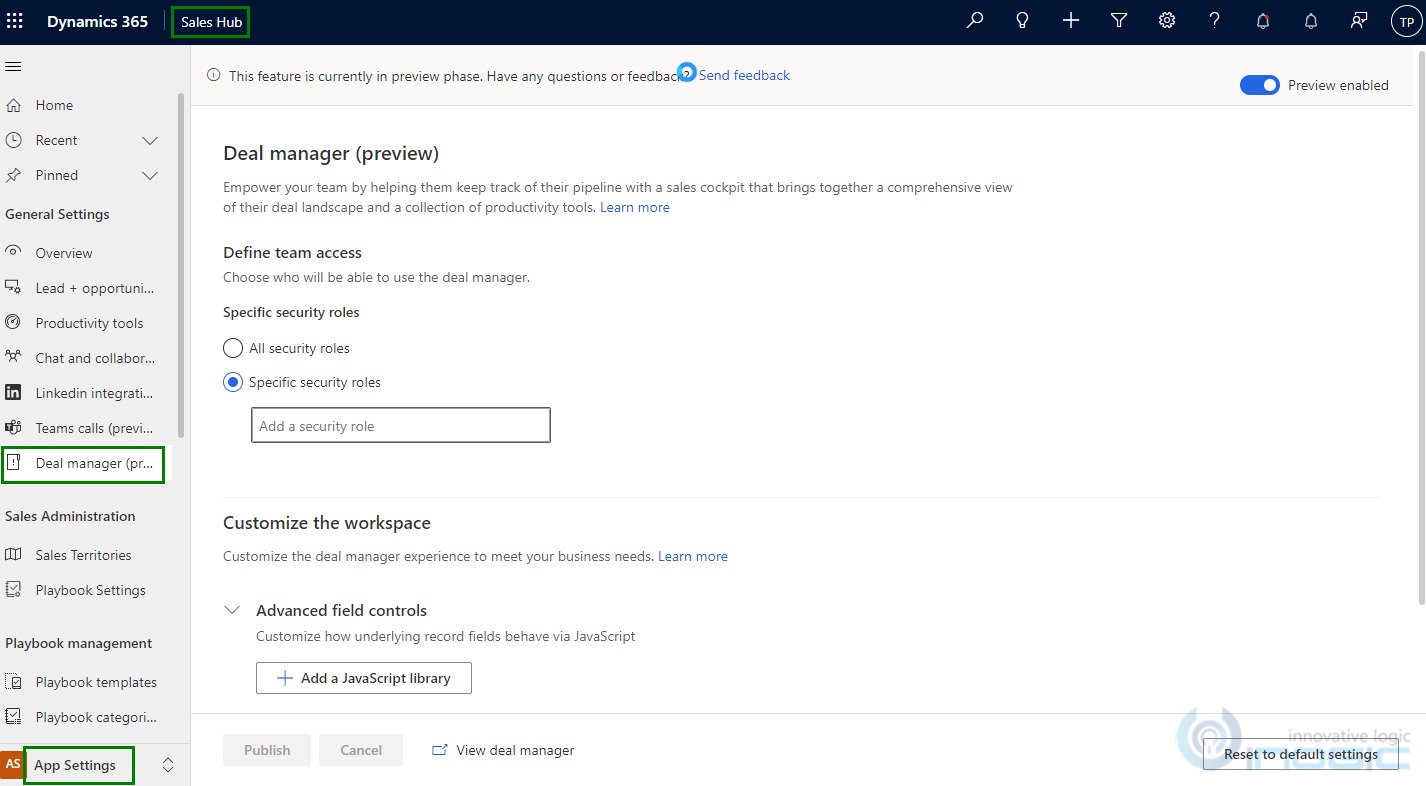
If you do not have the Sales Hub App or you want to add the Deal Manager Settings page in any other/custom App then you can follow these steps to add the settings page.
As seen from the screenshot below we have added the Deal Manager Settings page in Sales Team Member App.
You can choose who will access the Deal Manager by mentioning the Security Roles.
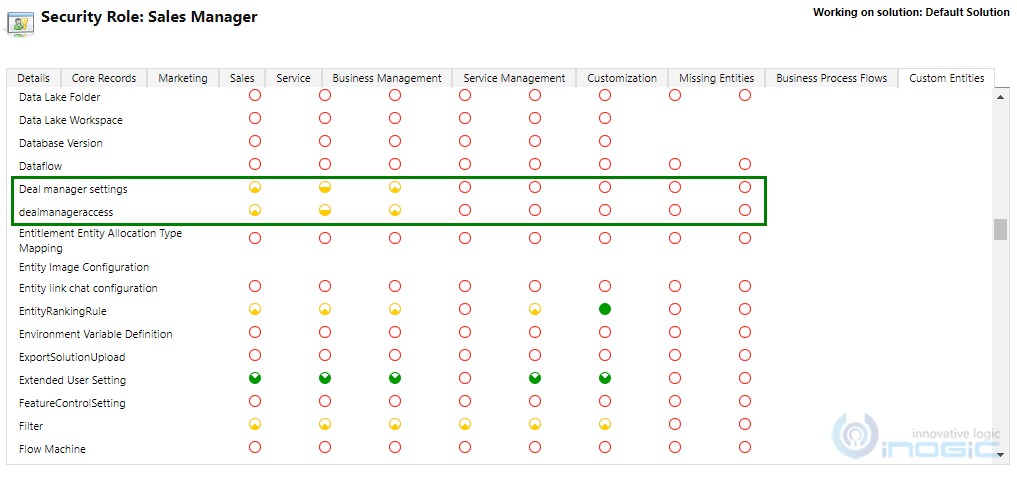
The Settings Page is only available for a user with the System Administrator security role, but if you want to allow users with different security roles as well to configure the Deal Manger, then you will need to add the privileges in their security role as shown below.
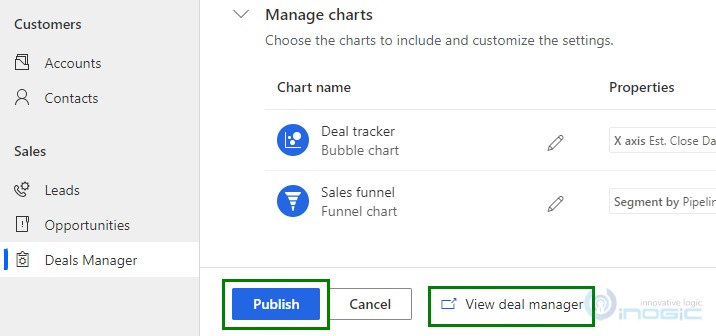
Next on the list is the charts, currently Deal Manager consist of 2 charts namely Bubble chart and Funnel chart.

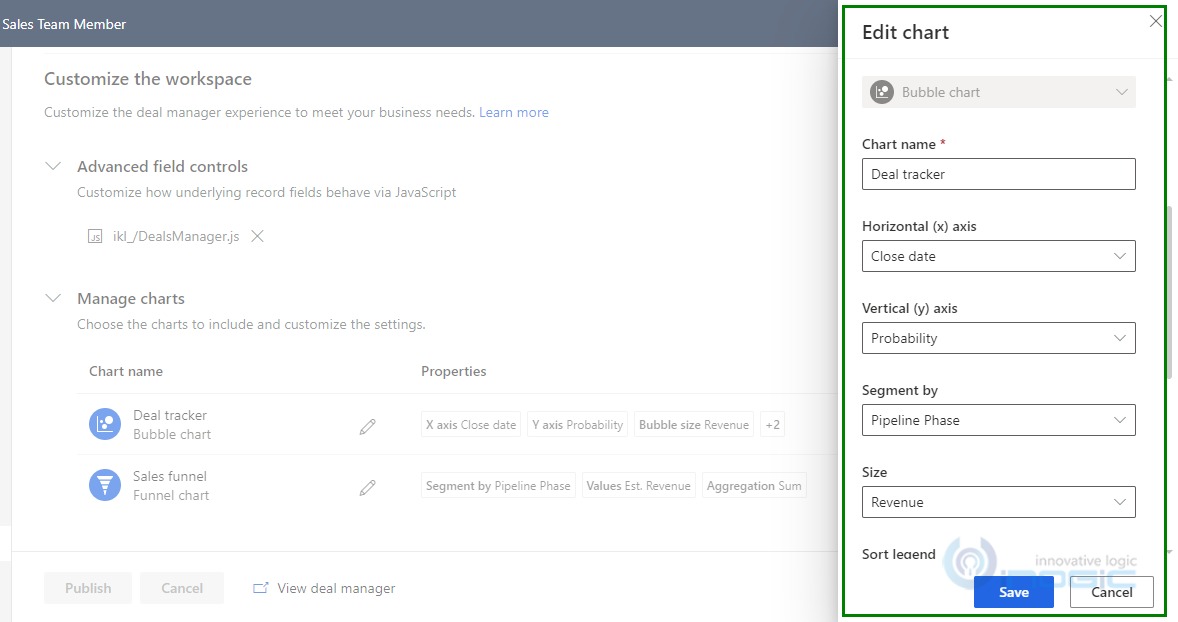
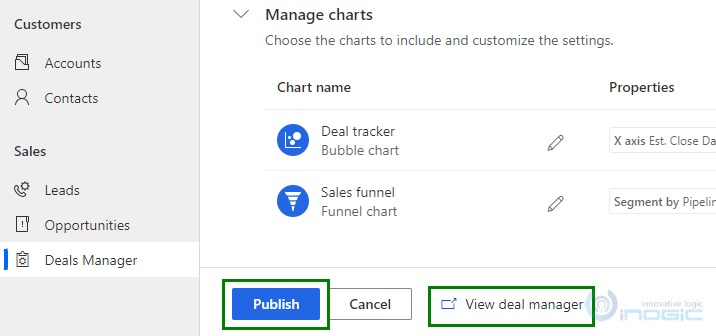
After updating the security-roles and charts publish the changes and click on View deal manager.
Once you click on the button View deal manager, a new tab will open under the same app where the deal manager has been configured (in our case it is the Sales Team Member App). In addition, the deal manager workspace starts showing under the Opportunity home view instead of the traditional home grid.
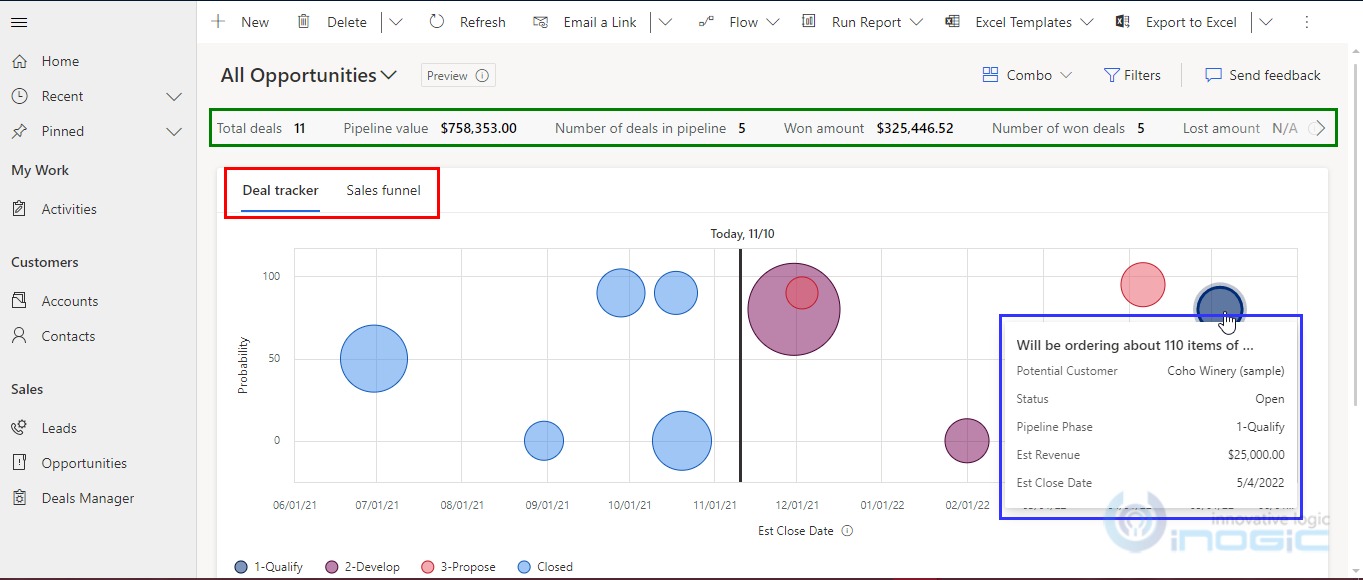
So let us go step-by-step, the part highlighted in green are Metrics, which shows the statistics (in numbers) of your opportunities. You can edit them as well by clicking on the Combo and Edit metrics.
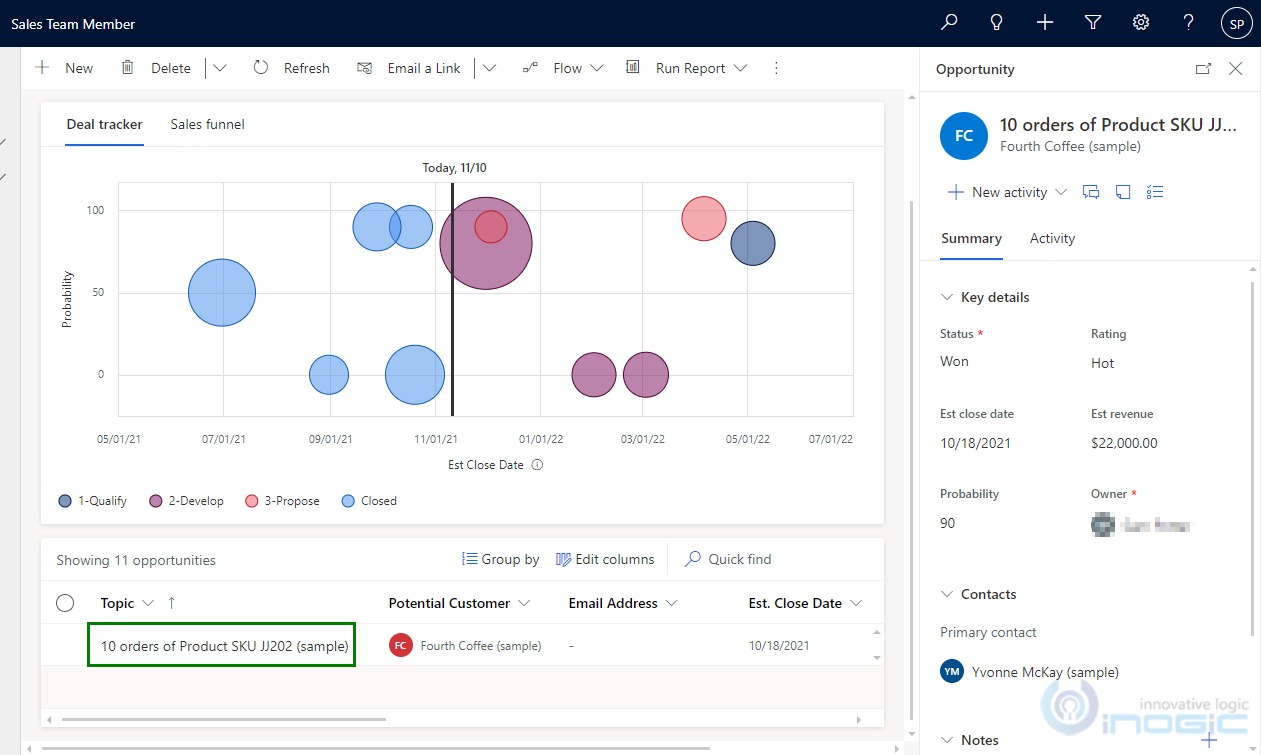
In the red highlighted part, we can see our two charts, which are providing the diagrammatical representation of opportunities. As shown in the above image, we can see the active bubble chart. The size of the circle i.e. opportunity record, represents the amount of estimated revenue. Bigger amount results in bigger circle. By hovering on the circle, you can read the data on a tooltip without opening the record.
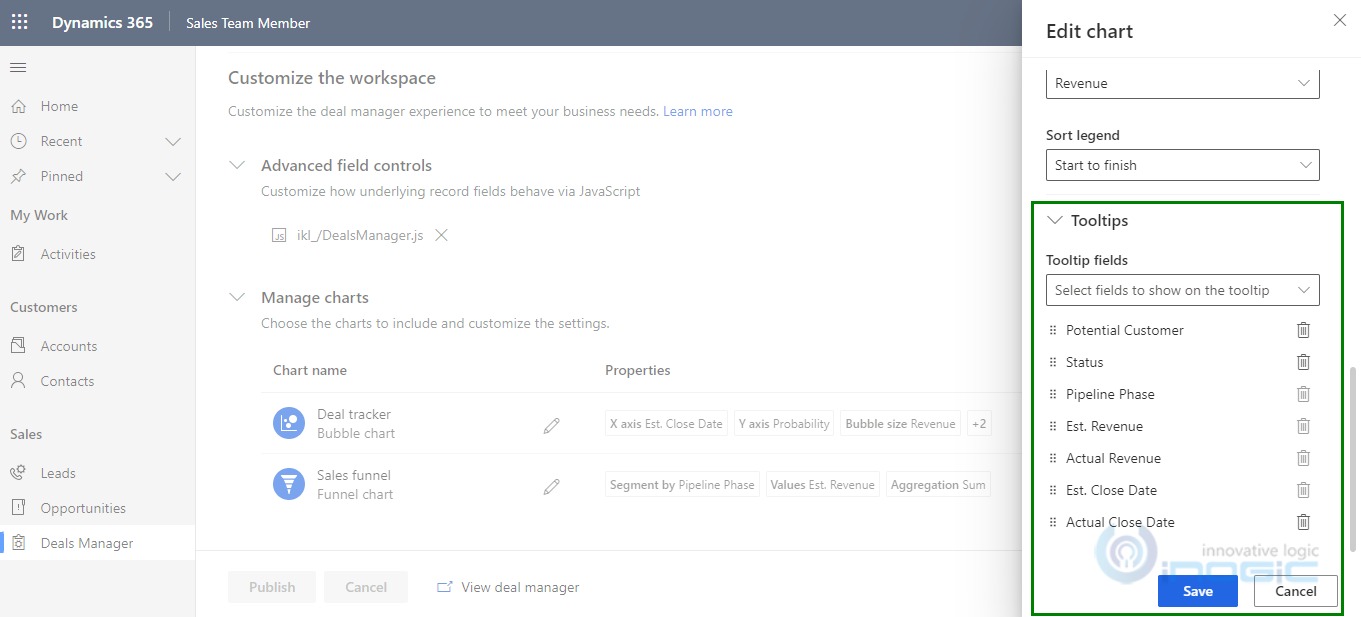
The fields shown in the tooltip can be edited as per your requirements from the Settings Page in the Edit Chart (Bubble Chart). When you scroll down, you will find the Tooltips section where you can add or remove the fields.
You can add up to 8 fields in total. Here, we added a custom field (Transaction Fees). Now, click on Publish and View Deal Manager.
As you can see in the below tooltip, our custom field has been added.
You would have also noticed different colors for different circles throughout the metrics. Each color determines different opportunity statuses, such as Qualify, Develop, Propose, and Closed.
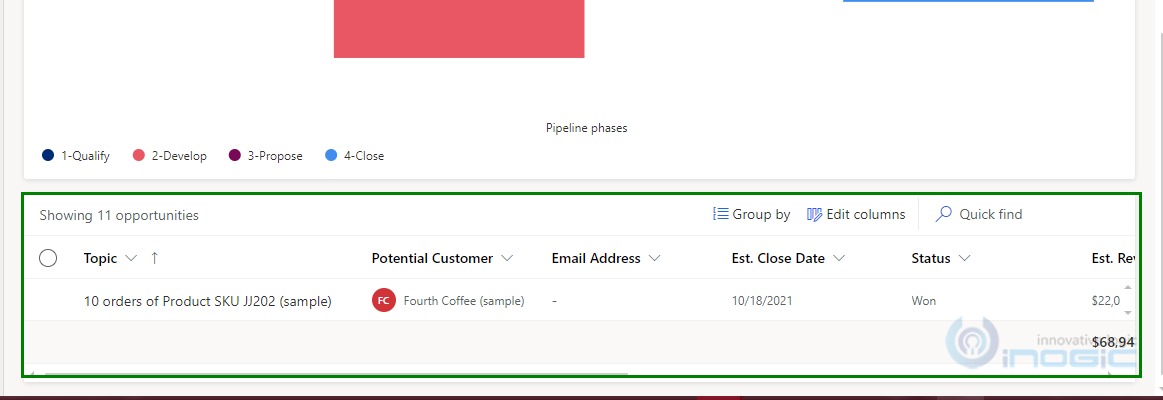
In the below charts, we have the editable grid, where you can edit the record from the grid.
In this grid, you can edit the columns such as add more columns or remove some. In addition, you can also group the records based on the fields shown in the view as columns.
To open the record, click on the record name in the Editable Grid. A quick view form will open showing all the fields from view.
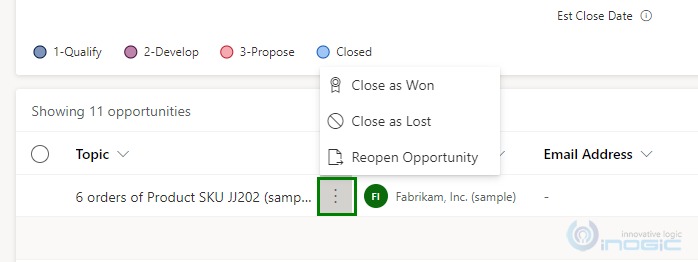
If you want to close the opportunity as Won or Lost or if you want to reopen the opportunity, then you don’t need to open the record. Just click on the 3 dots menu and all the options will be shown.
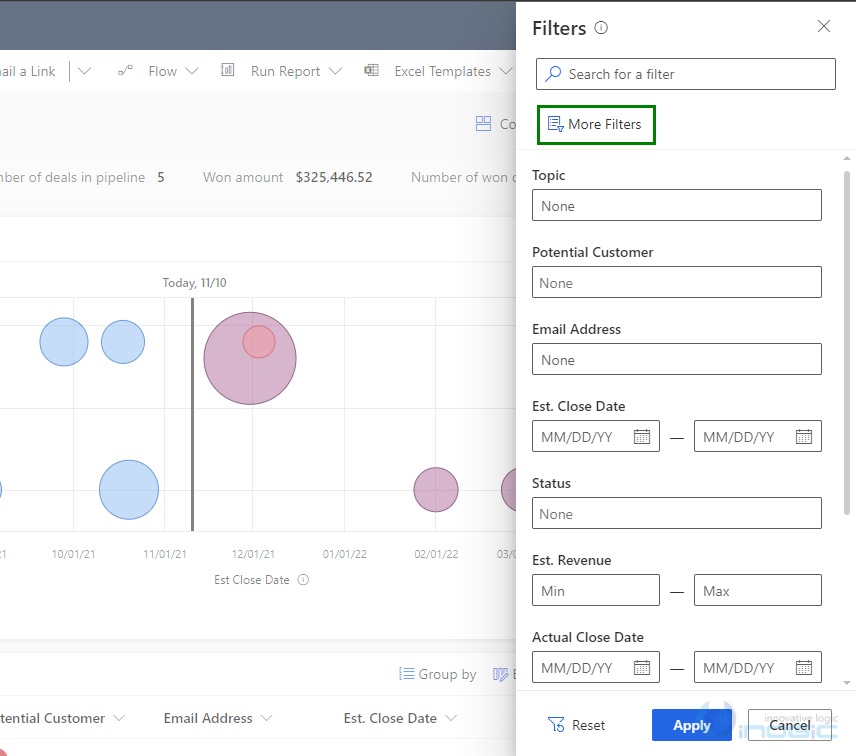
Now let us say we need to apply some filters to get the specific records. For this, we need to click on the Filter button on the top. A filter section will be shown where you can set your filters. The fields you see in the filter section are taken from the current view.
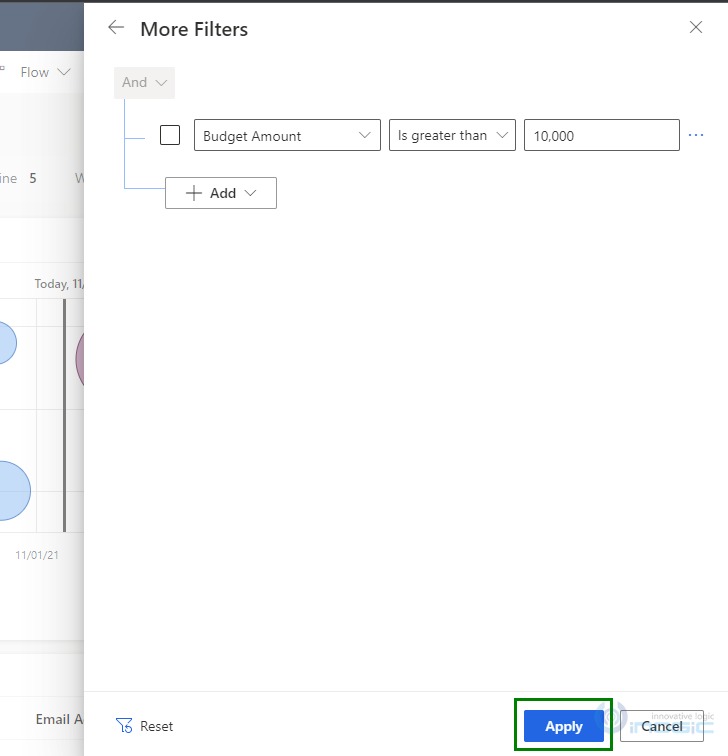
To add more filters on other fields, which are not available on the view, just click on More Filters.
In More Filters, you can add as many filters you like and then click on Apply to set them.
In some scenarios, you will be willing to work only on the Editable Grid and not the charts. In such scenarios, you can hide those charts with the help of the dropdown shown in the below image.
List – displays only the Editable Grid (List) in the Deal Manager workspace.
Combo – shows a combination of Charts and List.
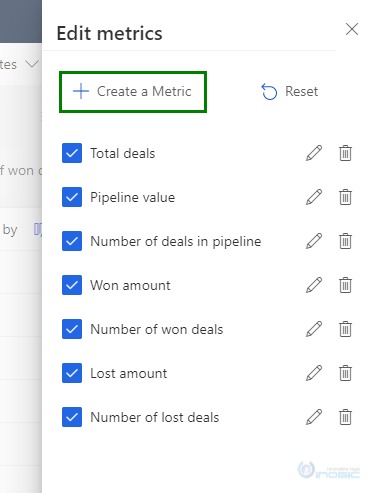
Now, there is another option as Edit metrics. This option will help you to customize the metrics shown in the workspace. By clicking it you will get the Metrics customization section where you can create, update or delete them.
To create a new metric click on Create a Metric.
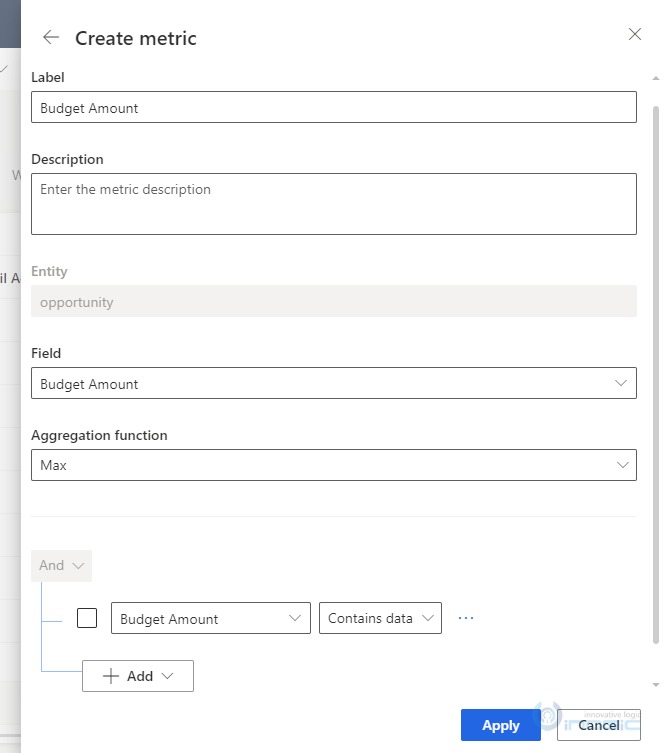
A form will open, where you need to select the field and the aggregate type based on which the data is to be calculated.
Here, we created one for Budget Amount, which will show the max amount on the metrics row. Beside this, you can also add filters in your metric, just as we added in ours.
After the addition of our metric, it can be seen in the workspace as shown in the above image.
Until now, we have seen the OOB customizations in the Deal Manager workspace. However, there is more to it, as to further expand the possibilities of customization in Deal Manager we can also add JavaScript web resources.
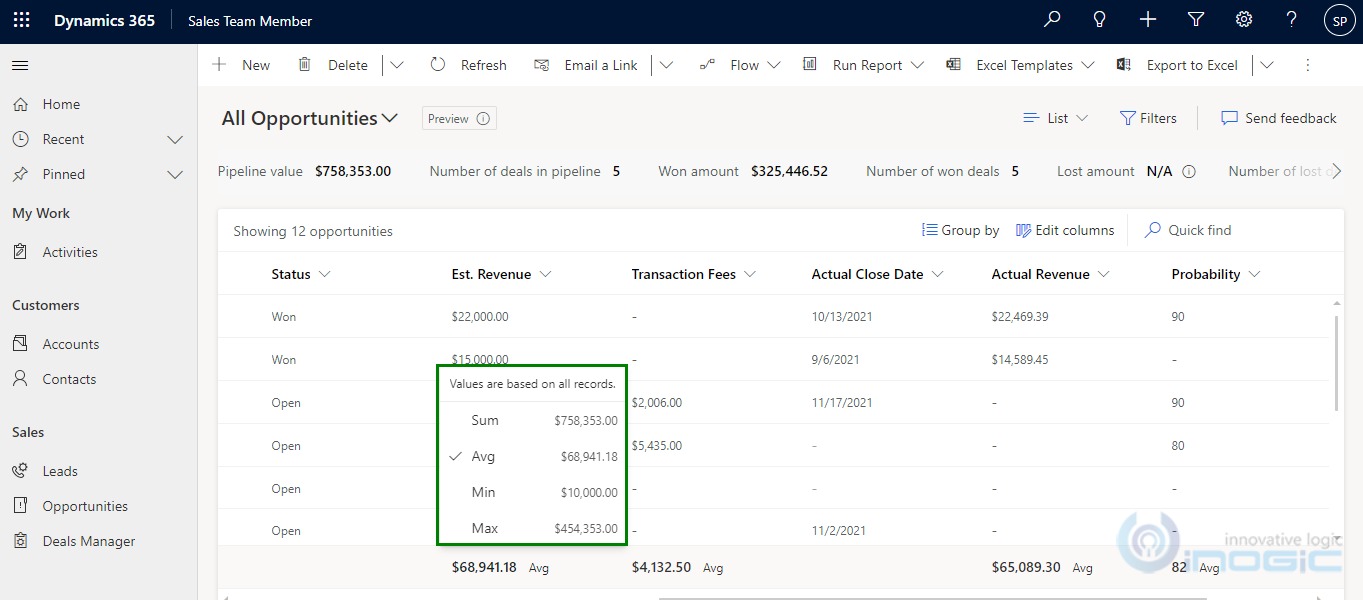
In Editable Grid, you can also see the aggregate value of numeric and currency fields in the bottom of the list. You can choose from SUM, AVG, MAX, and MIN by clicking on the value.
Moreover, these values are calculated based on all the records in your CRM instance.
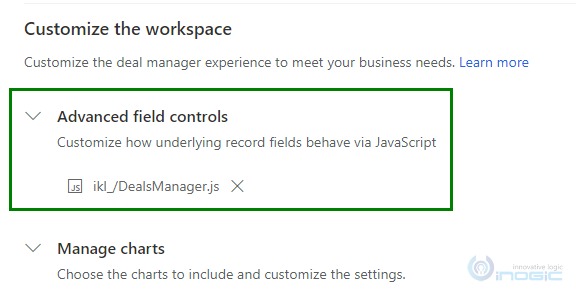
In Deal Manager Settings Page, we can see there is an option to select the JavaScript webresource. The Advanced field controls is where you can play with the column fields in the Editable Grid.
Microsoft has made it very easy to add web resources and make them trigger on load. The user just needs to select the web resource file in advanced field controls and that’s it, no need to add any function on any event.
Now let us say, we want to disable our custom field (name of custom field is Transaction Fees) in the Grid i.e. it should not be editable in the Grid as all other fields will be editable. We will have to write a function with name OnRowLoad. This will automatically get triggered on the load of rows in the grid.
Code:
function OnRowLoad(executionContext) {

var entityName = executionContext.getFormContext().data.entity.getEntityName();

if (entityName === "opportunity") {

executionContext.getFormContext().data.entity.attributes.forEach(

attribute => {

//Disable the custom field

if (["new_transactionfees"].includes(attribute.getName())) {

attribute.controls.get(0).setDisabled(true);

}

}

)

}

}
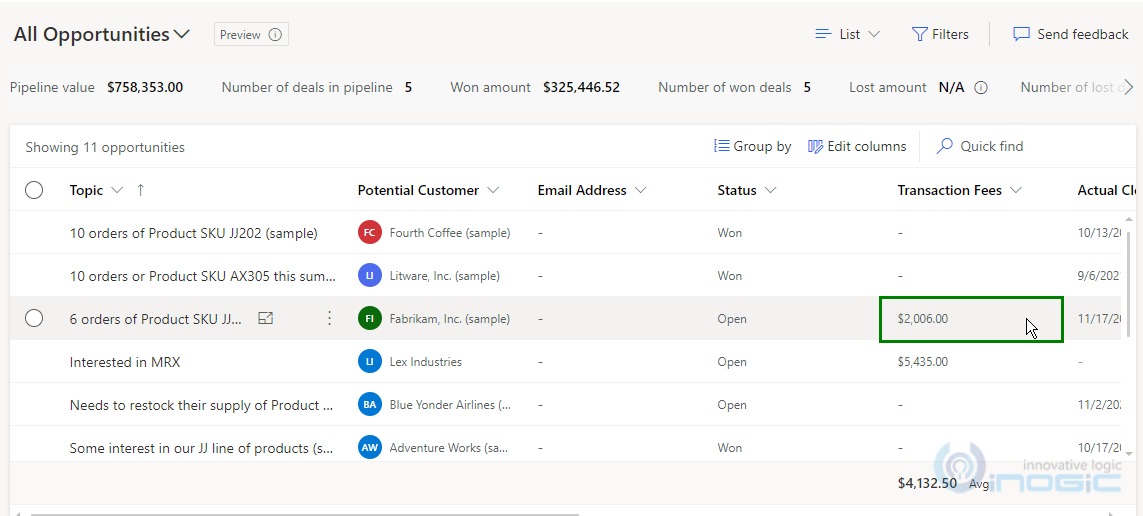
Now, if we hover on the Transaction Fees cell, we will not get the pen icon to edit it, which means that field has been disabled.
Conclusion:
In this way, you can easily customize the new Deal Manager workspace to improve the sales statistics.

