Maps integration with Dynamics 365 CRM accentuates result-oriented businesses in the direction of extracting maximum ROI. With this in vision, the app used for mapping should be in sync with the cutting edge technology to derive optimum output with the help of turnkey solutions. Keeping this in consideration, we pledge to launch new features in our CfMD (Certified for Microsoft Dynamics) app Maplytics every time our research team unravels some new feature in demand.
This time again, we have brainstormed and developed new features that follow state-of-the-art technology and are quite popular in Dynamics community. These features aim at improving the field presence of reps along with visualization power. Here are the features introduced in Maplytics April release:
- PCF Control – Detail Map Control for Dataset
- Truck Routing
- Multiple Categories
- POI Search with Keyword
Let’s understand them better with the help of a use case:
Detail Map Control for Dataset
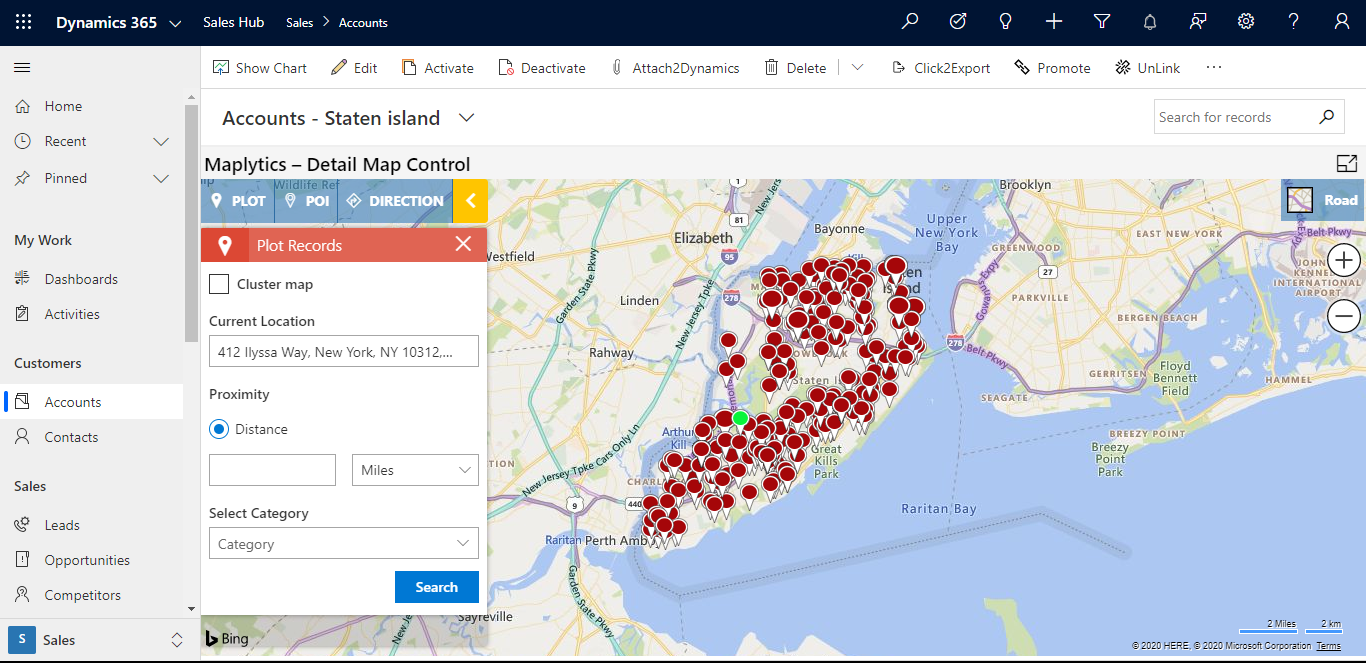
Suppose Sarah is a sales manager who looks after all the sales delivery of a branch of her organization in an oil factory. Sarah wants to visualize all the data of her organization together without having to switch screens. For this Sarah uses Detail Map Control for Dataset. With this, Sarah can add control to any entity or dashboard to visualize all the records of view, sub-grid or dashboard.
At any given instance Sarah can elect to choose multiple pushpins and highlight them to apply actions on them from the ribbon. With Detail Map window, users can implement following features:
- Plot entity records
- Plot categorized data
- Proximity search
- POI locations
- Routing
- Map mode and labels
Now that Sarah has visualized all her records from the Detail Map, she has to plot routes. She needs her rep to deliver volatile content to one of the clients by truck and needs the rep to be extremely careful. For this Sarah uses truck routing feature of Maplytics.
Truck Routing
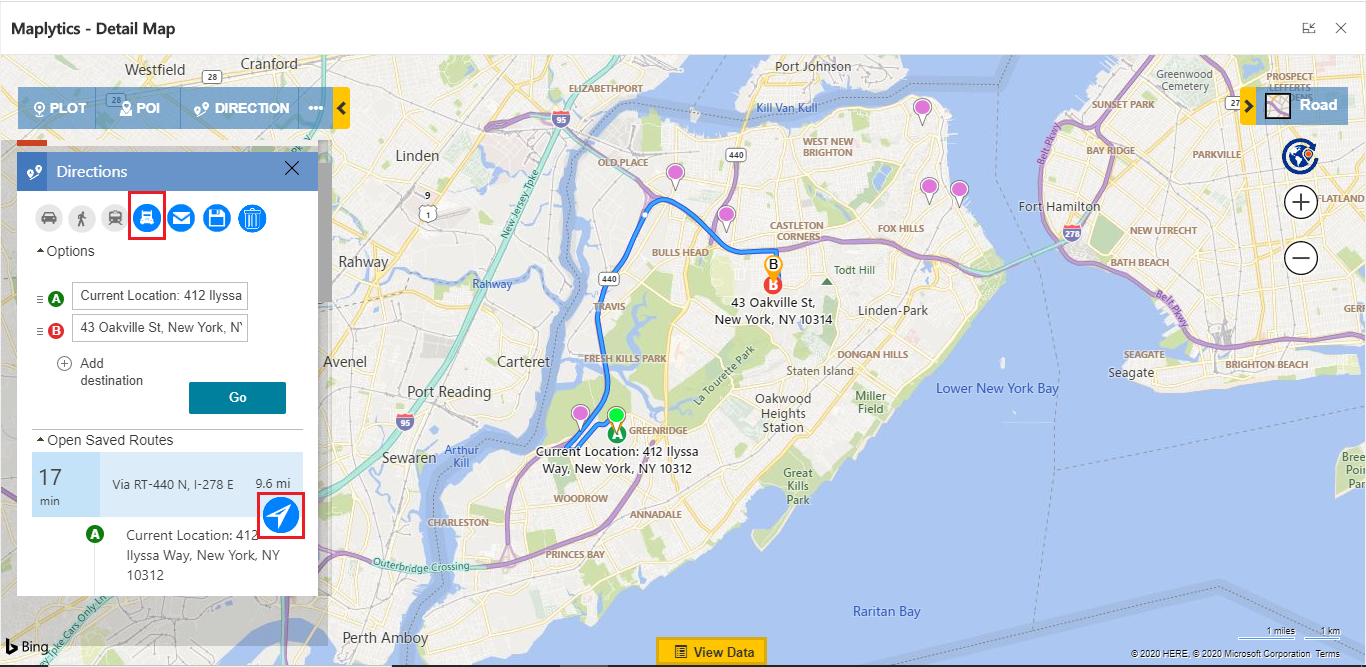
Now since Sarah has to deliver volatile oil to the petroleum station, she can’t have her rep follow the same route as every other vehicle. For this, she needs a route that is followed only by heavy vehicles such as trucks. So Sarah uses Maplytics to plot route from her head office to the destination. She mentions all the specifications of the truck and a targeted route is plotted on map.
The delivery is made successfully by following this route. Now, since Sarah is nearing the financial year-end, she needs to see which area has brought what revenue for the organization. For this Sarah needs a juxtaposed report of City, Owner (sales rep) and Annual Revenue. Sarah plots multiple categories for an in-depth insight into how the areas are performing.
Multiple Categories
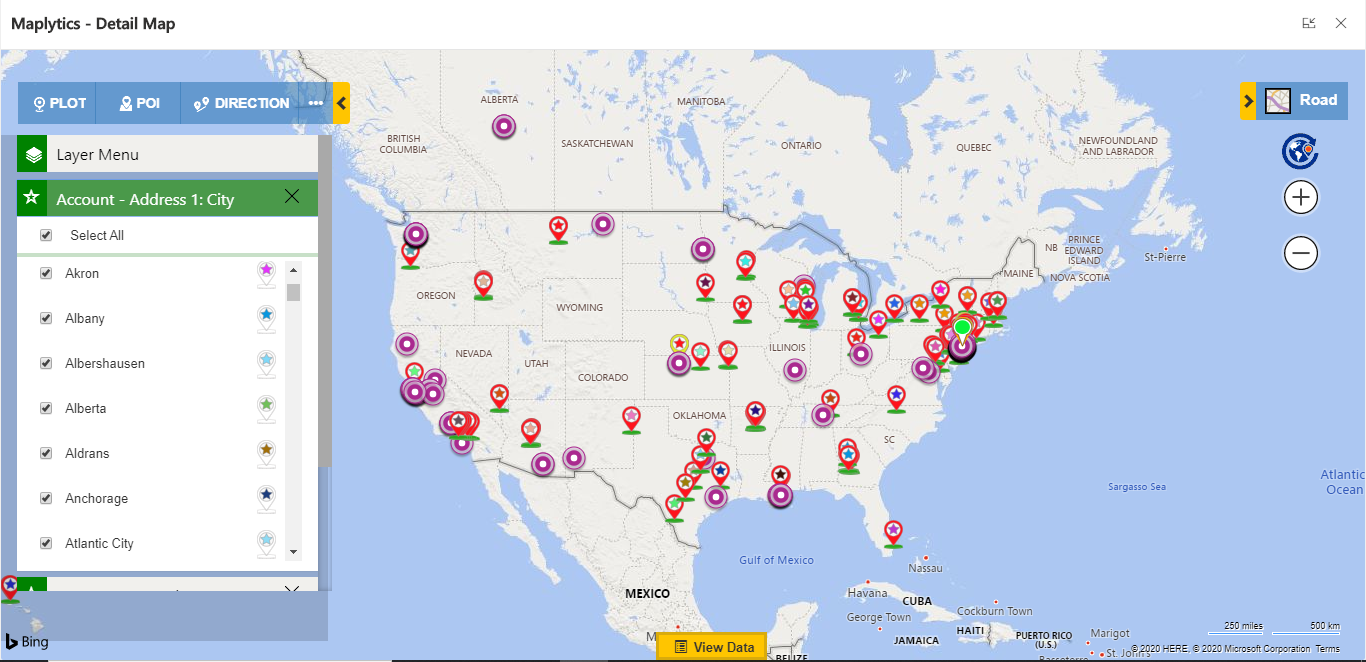
Sarah selects three categories viz. City, Owner and Annual Revenue for a single entity and plots them on map. The results are juxtaposed and therefore, Sarah can visualize what is the performance of each rep and how much revenue they have brought in which city.
Therefore, Sarah is done with her analysis in just the click of a button with Maplytics.
POI Search
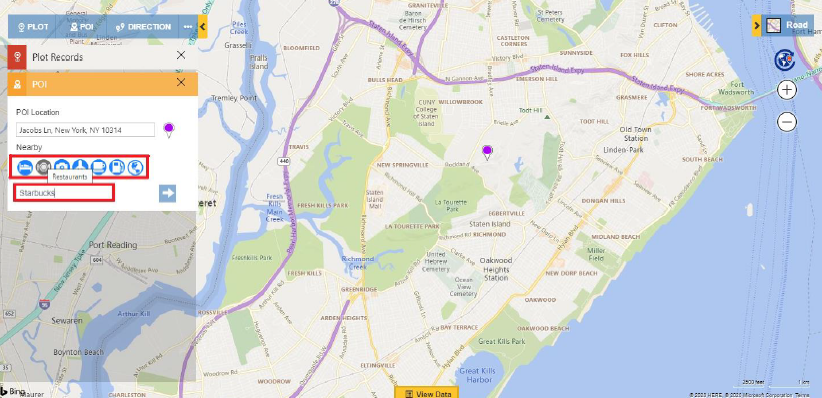
Now, suppose one of Sarah’s Sales reps wants to schedule an appointment with a prospect at nearby Starbucks. They simply enter Starbucks as the Keyword in POI and search for it. All the results for nearby Starbucks appear and required location can be chosen.
Therefore, you have seen how easily with the help of these new features we have optimized the performance of Dynamics 365 CRM mapping with maps.
To discuss more of your Location Intelligence needs drop an email at crm@inogic.com
Also, download the app for a free trial of 15 days from our Website or Microsoft AppSource!
