Introduction
In a recent business requirement, we were requested to display account details (account number, Email) horizontally by “Account Name” in the Power BI Report. When we selected a table to display data in our Power BI report, it displayed data vertically by default.
We explored more to figure out that we can’t format tables to show values horizontally. So, as a workaround, using a matrix, we formatted the table to display data horizontally.
Here, is how it is done-
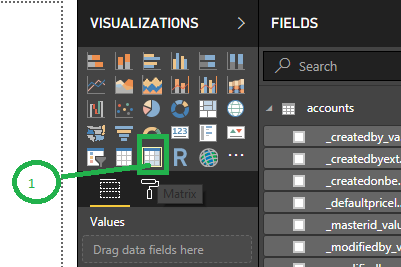
1. At first, we need to select Matrix to display data instead of a table
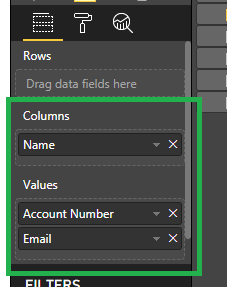
2. Now you need to select the fields that you want to show in the table. In our case we are showing Account name (name) as a Column, Account Number (account number), and Email (emailaddress1) as a Value.
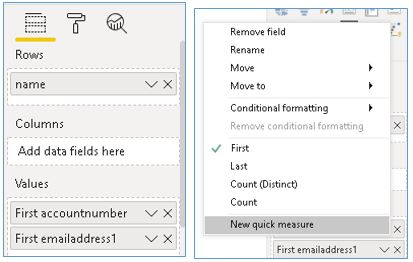
When we added a text field to the ‘values’ area, the fieldname was displayed as ‘First FieldName’ instead of ‘FieldName’. It also showed the field name as “First account number” and “First emailaddress1”. So, both field names are renamed.
By default, the selected property for the text field is “First”.
Why did it show “First Field Name” instead of “Field Name “?
We used the matrix so it grouped the result based on the “Column” value. In our example, the column name is “Name” (i.e. Account Name) so it grouped the result by “Account Name” value.
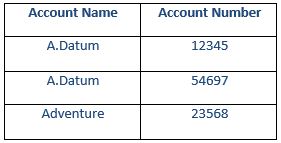
We added Account Number under values and selected property as “First” (i.e. First Account Number). Because of this grouping on Account Name, it showed only the first Account number where multiple Accounts had the same name.
Table: Sample data
Using Matrix:
- When we selected First option for “Account Number” column i.e. First Account Number
- When we selected Last option for “Account Number” column i.e. Last Account Number
- When we selected Count option property for Account Number i.e. Count of Account Number
So, according to your requirement you need to select property like First, Last, Count, Count (Distinct) and if you want rename the field column name.
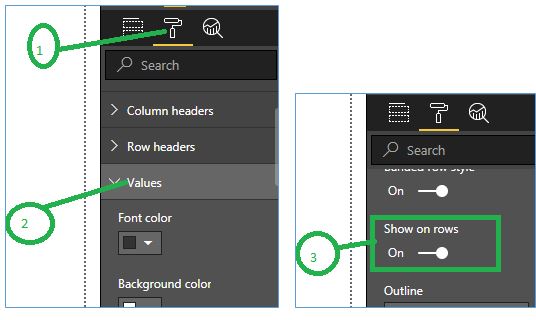
3. In final steps you need to turn on “Shows on rows” property under Values in Format tab. Please follow our below screenshots:
4. Now as you can see in our below screenshot our table data Account Number and Email are formatted horizontally and showing by Account Name.
Conclusions
By using Matrix feature of Power BI, we can aligned values in table horizontally.
Incorporating Power BI for business processes and exploring its advanced features is now easy!
Did you ask how? Join us at crm@inogic.com and our Team of experts at Inogic- Professional Services shall make the transformation a cakewalk!
Imagine, Believe, and Achieve with our technical expertise and functional experience




Hi
Loved the article. Just what I was looking for. One question, though – when I added a text field to the ‘values’ area, the fieldname showed as ‘First FieldName’ rather than just ‘FieldName’ as in your example above. I had to edit the field name in order to remove ‘First ‘. Did you have the same issue or have I missed something?
Regards
Ian
Yes, you need to edit the field name. In our case, we have renamed “First Account Number” with “Account Number”.
FYI, here we have used matrix so it groups the result based on “Column” value. In our example, the column name is “Name”(i.e. Account Name) so it groups the result by “Account Name” value.
We added Account Number under values and select property as “First” (i.e. First Account Number) then because of grouping on Account Name it shows only first Account number even if multiple Accounts have same name. For better understanding please refer our below example:
Table: Sample data
Using Matrix:
1. When we selected First option for “Account Number” column i.e. First Account Number
2. When we selected Last option for “Account Number” column i.e. Last Account Number
3. When we selected Count option property for Account Number i.e. Count of Account Number
So, here according to your requirement you need to select property like First, Last, Count, Count(Distinct).
Hope this helps.
Thanks!
Thank you! This helped me greatly. I appreciate it.