Introduction:
Microsoft Dynamics CRM 365 introduced additional controls for mobile and tablet to increase user interaction, user convenience and for user-friendliness. These controls are available for Mobile, Tablet application depending on the field type.
Today in this blog we will discuss about Bullet Graph Control.
Bullet Graph Control:
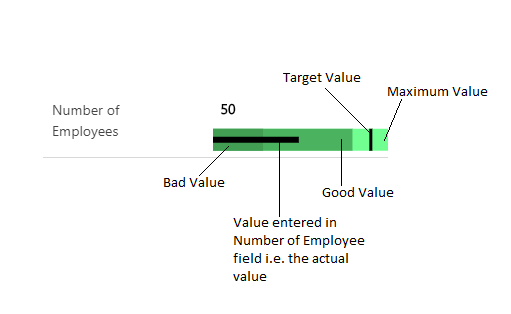
This control is used to represent field values graphically. We can add this control to the fields of type Whole number, Floating Point Number, Currency and Decimal Number. For this, we need to enter a value in the textbox of this control and then it will show that value in graph of control. To configure this control we need to provide Maximum, Minimum and Target, We can also provide Good and Bad value. These values gets differentiated by different shades.
Maximum Value – Maximum value to display on graph of control.
Minimum Value – Minimum value to display on graph of control.
Good Value – Good value to display on graph of control.
Bad Value – Bad value to display on graph of control.
Target – This is nothing but the value which we want to compare with actual control value.
We can add this control through customizations, go to customizations -> open the form -> click on field which we want to add this control -> click on Change Properties button.
For Example: Here we are adding bullet graph control on “Number of Employees” field.
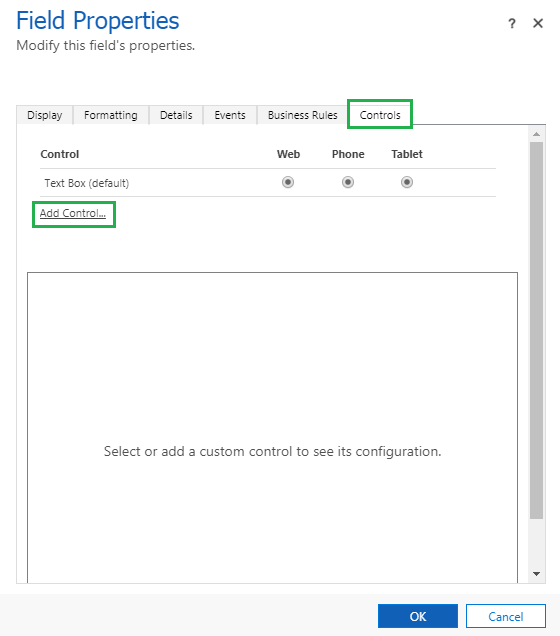
After clicking on “Change Property” button go to “Control” tab and then click on “Add Control” button as shown in below screenshot.
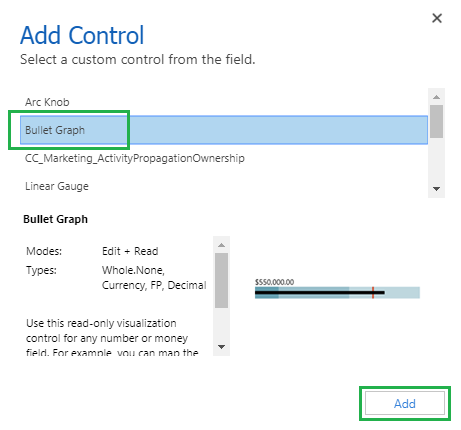
After clicking “Add Control” button the following window will get open and it will shows list of all controls, Select “Bullet Graph” control from the list and then click on “Add” button.
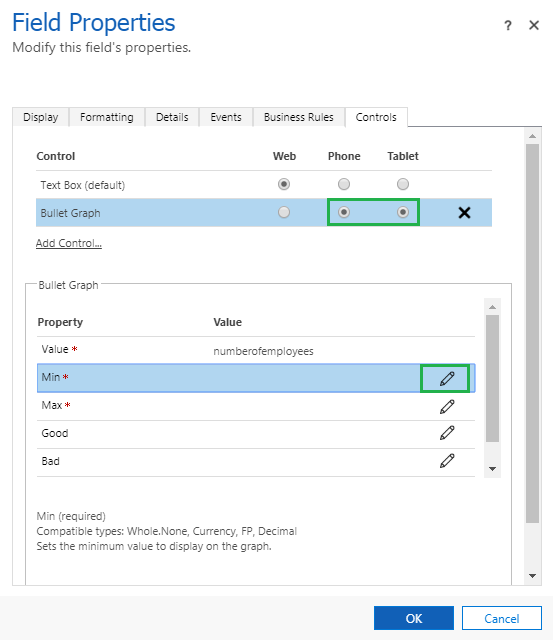
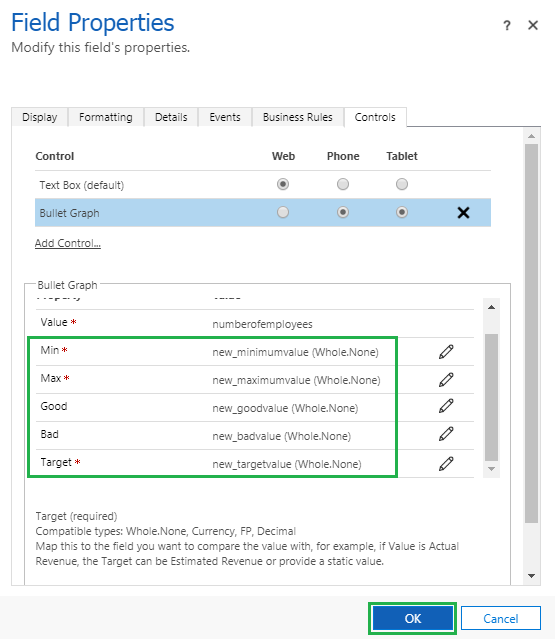
Then select Phone and Tablet radio buttons to show this control on Phone and Tablet, and then click on “Configure Property” button to set Minimum, Maximum, Good, Bad and Target values.
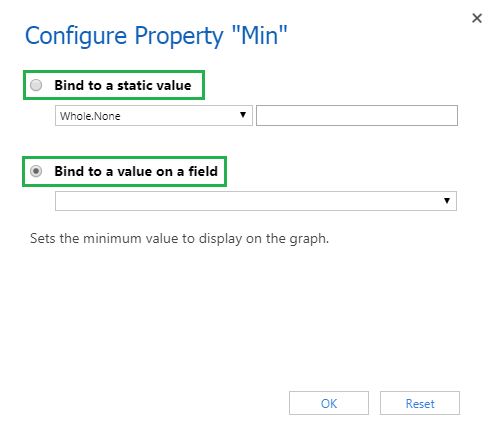
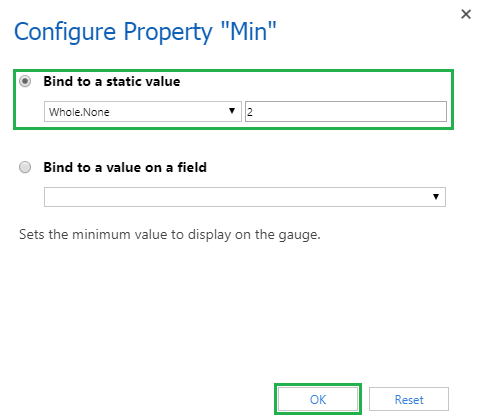
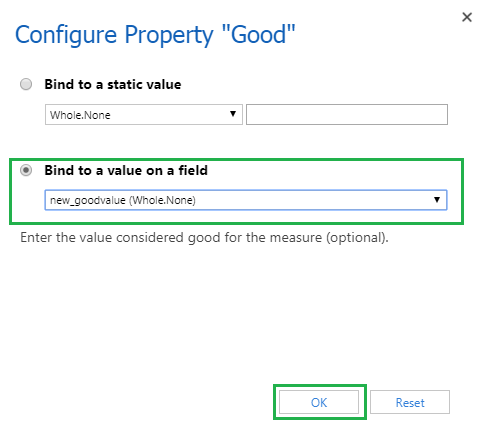
After clicking on “Configure Property” button the following window will get open which will display two options to set values
To set values using “Bind to a static value” we need to select “Bind to a static value” radio button, then select data type and then add static value in textbox and click on “OK” button.
To set values using “Bind to a value of a field” we need to select “Bind to a value of a field” radio button, select the field of whose value we want to use as Minimum Value, Maximum Value, Good Value, Bad Value or Target Value and then click on “OK” button.
Here we are setting values using “Bind to a value of a field” option, as mentioned in below screen clip for Min value we are using “Minimum Value” field value, for Max value we are using “Maximum Value” field value, for Good value we are using “Good Value” field value, for Bad value we are using “Bad Value” field value and for Target we are using “Target Value” field value.
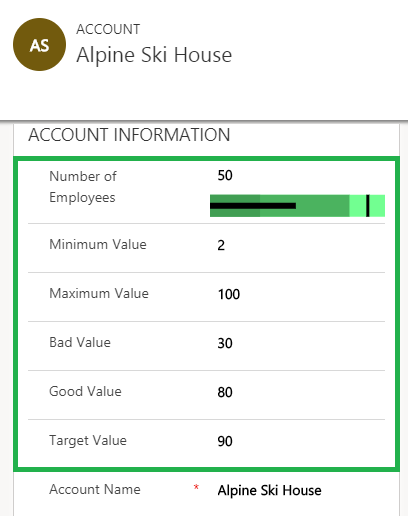
The Bullet Graph control will displays values graphically as per below screenshot, the value entered in control’s textbox getting appears on control’s graph in black colour.
Here is the graphical representation of Bullet Graph control values.
Conclusion:
In this way, we can add Bullet Graph control which allows you to enter data in and represent that data in graphical manner in user convenient way.
