Power Apps Component which was also known as Custom Control is the natural successor to HTML Web resources which was, or still is part of the Dynamics 365 CRM ecosystem for quite a long time.
Developers are quite skilled when it comes to HTML web resources, however, Power Apps Component Framework is pretty simple to pick up, and even for citizen developers it won’t be difficult to get started using Power Apps Component Framework all thanks to the very well written docs.
For those, who have already taken the plunge into Power App Component Framework would understand the time it takes from the building the component to the deployment in CRM (this could vary from few seconds to few minutes). At times, at the time of development you might want to deploy and check whether the piece written is working fine or not, but this might take a bit longer if you are doing this frequently.
Some might debate on why you even want to deploy the code to CRM for debugging, Power Apps Component team has already developed a test harness for the same. Well, I do not deny the fact that it is really a handy way of testing/debugging your component but at times your component would deal with various features that could be enabled from ControlManifest.Input.xml like WebAPI for which you need to deploy the code on CRM before you could actually debug and see if things are working right or not.
This blog will help you cut short the time it takes from building the component to the deployment by allowing you to debug the component without the need to deploy it to your environment with the help of Fiddler.
Let us see the step by step process of debugging the component using fiddler:
Step 1: Install Fiddler and configure it following these steps
Step 2: Open the page or form where you have configured your component
Step 3: Open the Developer Tools. (Shortcut in Chrome is F12)
Step 4: Go to Sources Tab and from the Navigator locate your CRM URL and within that your Component
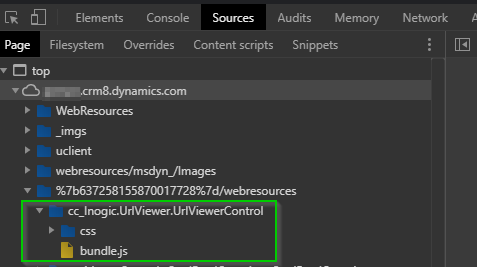
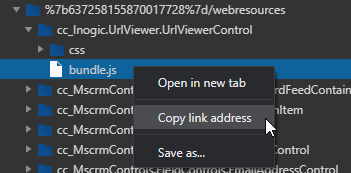
Step 5: After locating your Component, Right Click on bundle.js and Copy link address
Step 6: Paste that link in a browser, so that it is easier for you to match it in the AutoResponder of Fiddler
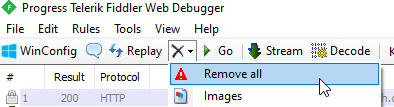
Step 7: Clear the Sessions that are already captured in Fiddler using the Remove All button
Step 8: Hit search/enter to the link pasted in Step 6, this will be captured in Fiddler
Step 9: Select the captured session and click on AutoResponder
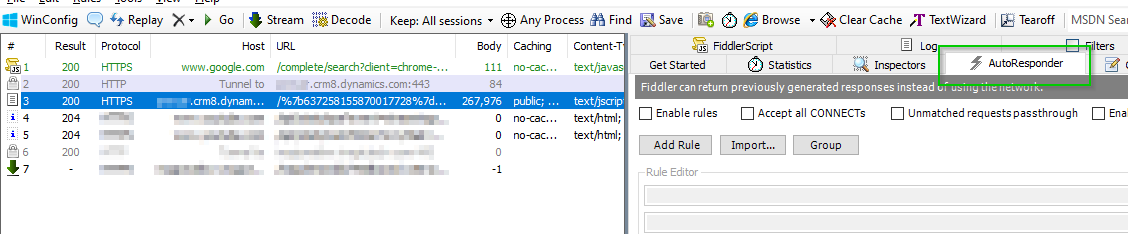
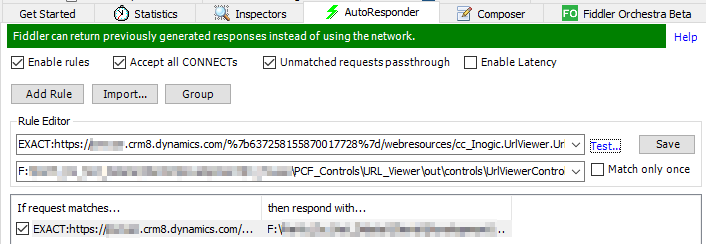
Step 10: In the AutoResponder,
Select Enable rules, Accept all CONNECTs and Unmatched requests passthrough
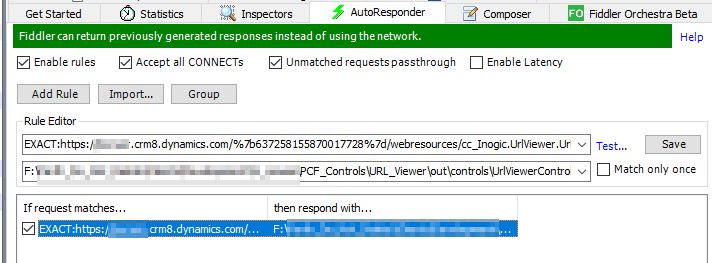
Step 11: Add Rule in the AutoResponder, when you click on Add Rule the first text box is filled with your CRM file path. In the second text box, put the path of the file on your local machine
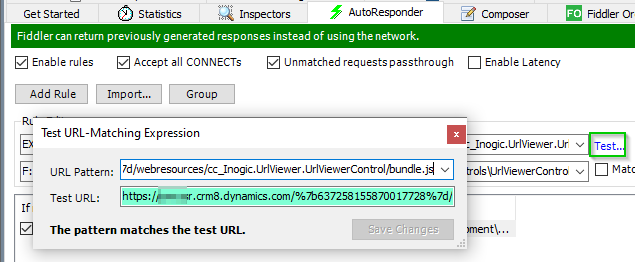
Step 12: Hit Test to see if the pattern matches the test or not
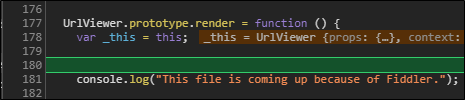
Step 13: Next I will make some changes in the Component file and build it and thereafter will refresh the page to see the file being pulled from local machine and not from CRM.
Note: If normal refresh does not work for you, try Empty Cache and Hard Reload.
Step 14: After Empty Cache and Hard Reload (I prefer doing this), I could see the file being pulled from my local machine.
Conclusion
Now, debugging your piece of logic in the component will not take much time.