With the help of Maplytics you can plot multiple addresses on map for a single entity of Dynamics CRM. For example, if your account have two addresses, one is used for Bill to and other is used to Ship to and you want to plot your ship to and a bill to addresses separately, then you can achieve this functionality with the help of Bing map integration with Dynamics CRM solution – Maplytics. Please follow below mentioned steps to achieve this functionality.
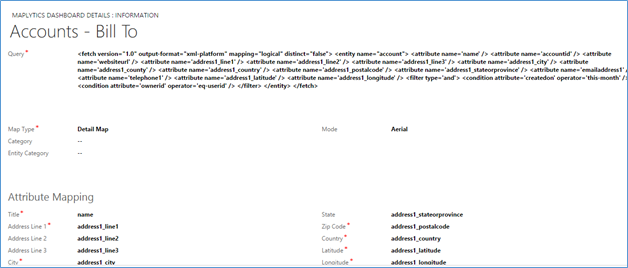
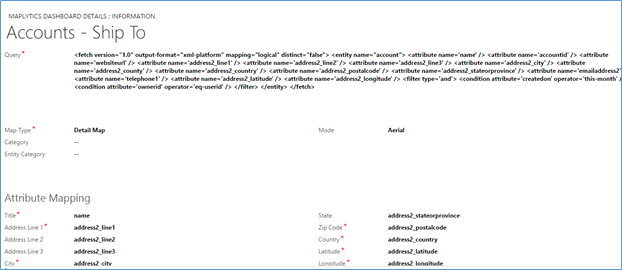
Step 1: Create the dashboards records, one for bill to and other for ship to as shown in below screenshot. Go to Setting > Maplytics Dashboards
In Bill to dashboard record, select address1 fields as shown in below screenshot.
In ship to dashboard record select address2 fields as shown in below screenshot.
Maplytics – Your Favourite Maps integration solution with Dynamics CRM helps in geo-coding Dynamics CRM data and comes along with Geo-coding workflows to geocode addresses. As we have geocode workflow (i.e. to get the latitude and longitude) developed only for address1 so you have to configure geocode workflow for address2. You can refer this blog to know how to configure it.
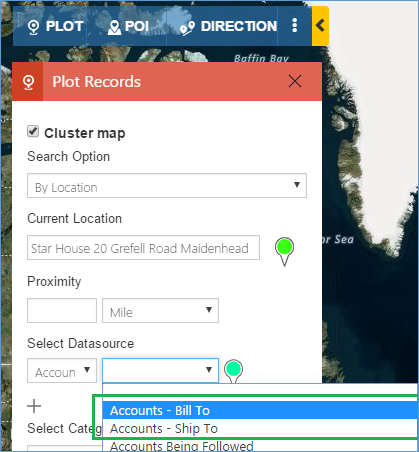
Step 2: Once you define the dashboard records and then go to account entity and open the detail map in Dynamics CRM by clicking on Detail map button, you will see this two dashboard records in view selection dropdown. From here, you will select either of dashboard record to plot the records on map. For example, if you want to plot the Accounts whose address are Bill to then you have to select Accounts – Bill To of dashboard record.
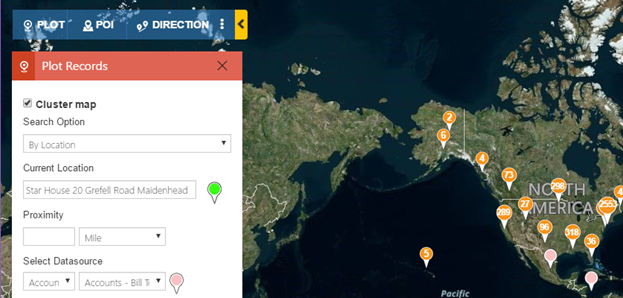
Step 3: After selecting the dashboard view, it will plot the accounts based on Bill to address ( i.e. Address1) as shown in below screenshot.
In this way, using Maplytics – Microsoft Dynamics CRM mapping solution you can plot multiple addresses of same entity of Dynamics CRM.

